![]()
The variance/SNR and the entropy are two quantitative way to measure
the performance of a filter. However, it is also important to include visual
criteria especially if the image is to be partially reconstructed from the
pyramid. Two of them who appeared to be of particular interest were
selected : edges resolution and aliasing.
The higher frequencies contain a lot of the information about the
details of the pictures. As we remove the lower error levels of the
pyramid, the
reconstructed image tend to be blurred.
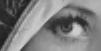
This effect is illustrated here : the two examples are taken from boats.tif(260:310,300:400)
and lena.tif(240:290,200:300).
The original image is compared to the image reconstructed without taking
the last error image of the pyramid.
(note : all the picture have been zoomed by a factor 2)
|
|
 |
 |
|---|---|---|
|
|
 |
 |
|
|
 |
 |
|
|
 |
 |
|
|
 |
 |
|
|
 |
 |
|
|
 |
 |
|
|
 |
 |
Burt(0.6) and even more Haar do a poor job. Haar shows blockiness,
while Burt(0.6) does not handle the edges very well (e.g. look at the
edges of
the hat in lena).
All the other methods do a comparable job. Ideal handles the
edges the best. However, we found that the result given by Spline(3) and
Optimal non-linear was more appealing.
It is interesting to note that visual quality and MSE are not always
correlated. For example, Spline(3) gives similar results to Optimal Cubic
even though there is a 4dB difference in the SNR and gives much better
results than Burt(0.6) even though there is hardly a 1dB difference in
the SNR.
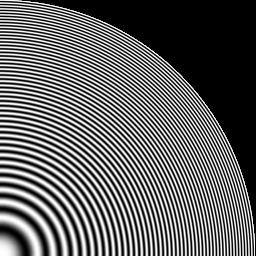
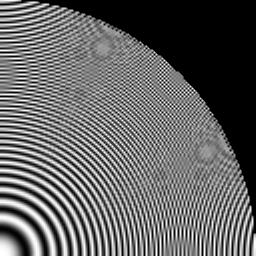
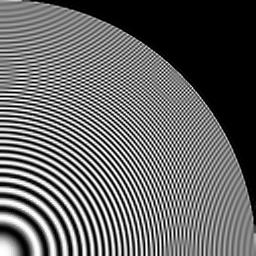
The image "zone" is particularly well suited to check the effect
of the aliasing. It contains a wide variety of frequencies up to the Nyquist
sampling limit : it is therefore a good way to check the anti-aliasing
quality of the pre sampling filter.
| Original Image | Haar | Burt(0.6) |
|---|---|---|
 |
 |
 |
| Cubic(15) | Ideal | Spline(3) |
|---|---|---|
 |
 |
 |
| MMF(3) | Optimal non-linear |
|---|---|
 |
 |
In order to get no aliasing at the lower resolution, the pre sampling
filter should be as close as possible to a perfect low pass filter with
a cut-off frequency at pi/2 (assuming a decimation by 2 is performed from
one level to the other).
From this observation, the optimal reconstruction filter is a low pass
filter which allows us to recover all the frequencies from 0 to pi/2 of
the initial image without aliasing (cf Ideal)
The top level error image is for this reason a high passed version of the original picture. It contains the finer details of the picture that need to be added to the interpolated lower-resolution picture. In this sense, the pyramidal structure as described here is not optimal : the information of that top level image contains frequencies ranging from pi/2 to pi, : it is over sampled and could therefore be stored more efficiently.
This study is also interesting when put in relation with the SNR performance. The top level image contains all the energy of the higher frequencies. The compression rates are therefore going to be mainly influenced by the frequency distribution of the original picture and by the quality of the low pass filter. For example, if a perfect low pass filter were used before down sampling and for reconstruction, the entropy of the top level error image is directly related to the energy of the pi/2-pi frequency band (from Parseval's theorem).
![]()
