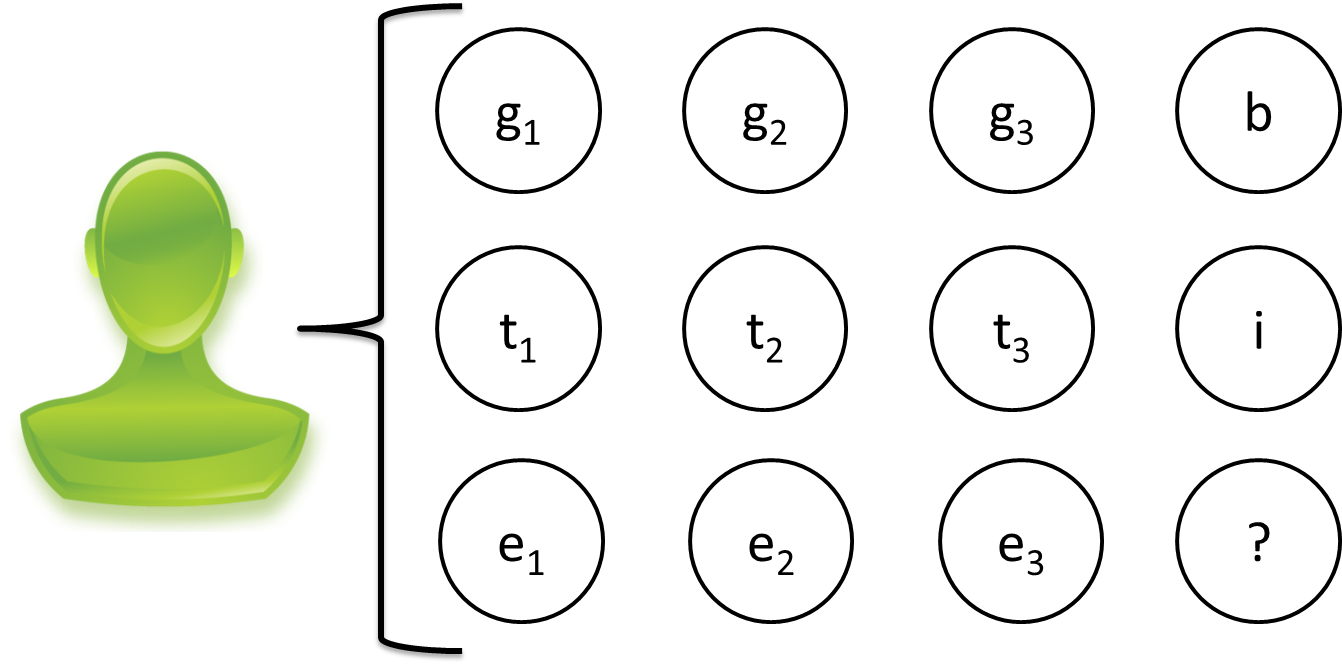
For each student we have a large set of observed variables. The three grades the student received on the first pset $g_1, g_2, g_3$, how much they enjoyed each problem $e_1, e_2, e_3$ and how much time it took them $t_1, t_2, t_3$. We also know the student's background $b \in \left\{ {bs, ms, phd, scpd}\right\}.$


Getting accurate feedback for an assignment is a cornerstone of the educational process. But it can be obscured by the presence of grading errors. To maximize our grading accuracy we can use related variables to notice which assignments have suprisingly high or suprisingly low grades and warent a deeper inspection. This handout describes the problem of predicting which homeworks have been misgraded (an unsolved problem) using bayesian nets (a beautiful formalization).


The Basic Idea

The challenge is simple. Design a bayesian network which you think best describes the causal relationship between the given variables. We will chose five finalists, that we will evaluate on real data. The winner will be used for a research project. Based on the predictions of the winning model, we will regrade up to 10 homeworks (an additional 10 homeworks will be regraded as part of a control set, chosen randomly).
You must formulate your prediction as a bayesian network (watch out for directed cycles) for two reasons. (1) We are practicing bayesian networks and (2) it is a great model for this task. Your network is allowed to have additional variables, that are observed (for example a variable for a student's grit)-- we haven't gone over how you can populate CPDs for networks that has unobserved variables. That is the material for thursday's class. If you use unobserved variables, your model could be the class demo :). As a note, though you might be tempted to include a lot of causal relationships know that when you have a small amount of observations to learn from, simple models tend to do better.
Thus, your task is straight forward: come up with the best probabilistic description of how the world of homework grades works.
Contest:
Submit a model by Monday at 11:59pm and stand a chance to win extra credit and make a novel contribution to education research.

Modeling

After giving it some thought I imagined the world working as depicted in Model A. The variables I have introduced are, for each assignment $i$ there is a difficulty $d_i$ and each student has a variable "grit" which represents how hard the student is willing to work to overcome obstacles. It turns out that grit, and having a growth mindset are some of the best predictors of student success. I am going to assume for my model that $g \in \left\{ {+, v+, v, v-, -}\right\}$, $t \in \left\{ {low, med, high}\right\}$, $d \in \left\{ {low, med, high}\right\}$, $grit \in \left\{ {low, med, high}\right\}$, $e \in \left\{ {1, 2, 3, 4, 5}\right\}$. In the models we can share CPTs over all nodes of the same type.

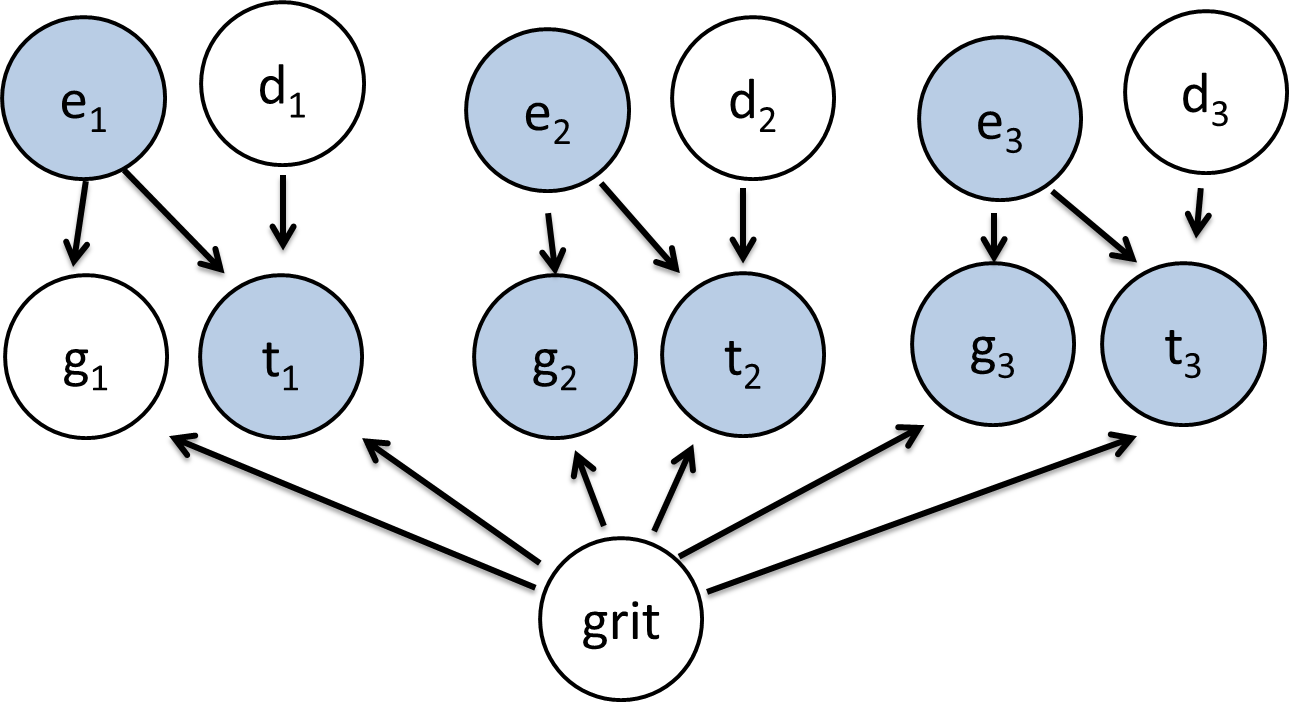
Model A: The variables and their relationships. Depicts a single student.

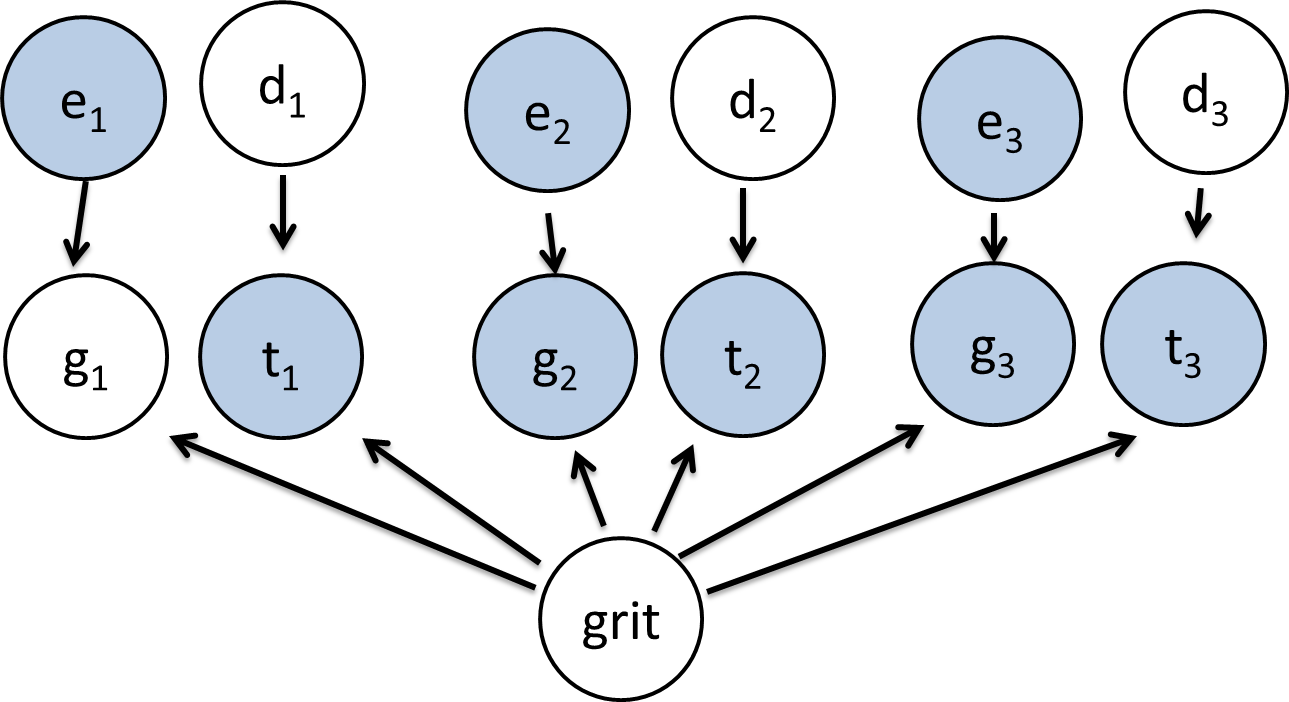
Model B: Also only depicts one student.

Though model A, might be a better description of the world, the CPT for time is problematically big. The size of the table is equal to the product of the size of the domains of time's parents, which is 45! I think that we don't have quite enough data to accurately fill the CPT. Therefore I think the best model for predicting regrades is model B which makes the necessary, but incorrect, assumption that enjoyment does not directly cause someone to spend more or less time on homework.
A few asides: First, I have assumed that student backgrounds are independent of all the variables depicted in the models. Second, I think that what students are interested in does effect if they enjoy a problem. But since the enjoy variables are observed, knowing a persons interest does not change my belief about what grade they will get.
Have a better idea?

Submission

Participating in this challenge is optional. If you wish to participate, email a model to the staff by Monday at midnight with the subject "Modeling Regrades." We will then chose our favorite five as finalists.
In your submission be precise about the bayes net you are proposing and justify your choices (if possible please include a figure). Specifically we need: the variables, their domains, which arcs have the same CPTs.
The student whose model best fits the data will have their worst pset grade (for a single problem) changed to a +.