PCA : Interpretation Examples
These example provide a short introduction to using R for PCA analysis. We will use the dudi.pca function from the ade4 package
install.packages('ade4')
> library(ade4)

Attaching package: ‘ade4’

The following object(s) are masked from ‘package:base’:

    within

> data(olympic)
> attach(olympic)
>
Two example datasets
Turtles is Jolicoeur and Mossiman’s 1960’s Painted Turtles Dataset with size variables for two turtle populations.
The decathlon data are scores on various olympic decathlon events for 33 athletes. It is already contained in the package ade4. The R object olympic is composed of a list of 2 components:
tab is a data frame with 33 rows and 10 columns events of the decathlon: 100 meters (100), long jump (long), shotput (poid), high jump (haut),400 meters (400), 110-meter hurdles (110), discus throw (disq), pole vault (perc), javelin (jave) and 1500 meters (1500).
- score
is a vector of the final points scores of the competition.
Start with unvariate and bivariate statistics
>    Turtles=read.table("/Users/susan/sphinx/data/PaintedTurtles.txt",header=
T)
>    turtlem=Turtles[,2:4]
>    save(Turtles,file="Turtles.save")
>    save(turtlem,file="turtlem.save")
>    apply(turtlem,2,summary)
        length  width height
Min.      93.0  74.00  35.00
1st Qu.  106.8  86.00  40.00
Median   122.0  93.00  44.50
Mean     124.7  95.44  46.33
3rd Qu.  136.2 102.00  51.00
Max.     177.0 132.00  67.00
>    round(cor(turtlem),1)
       length width height
length      1     1      1
width       1     1      1
height      1     1      1
>    round(cov(turtlem),2)
       length  width height
length 419.50 253.99 165.83
width  253.99 160.68 102.19
height 165.83 102.19  70.44
>    turtlesc=scale(turtlem)
>    round(cov(turtlesc),2)
       length width height
length   1.00  0.98   0.96
width    0.98  1.00   0.96
height   0.96  0.96   1.00
>
Now we compute the principal components of the data:
��������������������������������������������������������������������������������������������������������������������������������������������������������������������������������������������������������������������������������������������������������������������������������������������������������������������������������������������������������������������������������������������������������������������������������������������������������������������������������������������������������������������������������������������������������������������������������������������������������������������������������������������������������������������������������������������������������������������������������������������������������������������������������������������������������������������������������������������������������������������������������������������������������������������������������������������������������������������������������������������������������������������������������� > require(ade4) Loading required package: ade4 Attaching package: ‘ade4’ The following object(s) are masked from ‘package:base’: within > load("turtlem.save") > pca.turtles = dudi.pca(turtlem,scannf=F,nf=2) > print(pca.turtles) Duality diagramm class: pca dudi $call: dudi.pca(df = turtlem, scannf = F, nf = 2) $nf: 2 axis-components saved $rank: 3 eigen values: 2.936 0.04284 0.02142 vector length mode content 1 $cw 3 numeric column weights 2 $lw 48 numeric row weights 3 $eig 3 numeric eigen values data.frame nrow ncol content 1 $tab 48 3 modified array 2 $li 48 2 row coordinates 3 $l1 48 2 row normed scores 4 $co 3 2 column coordinates 5 $c1 3 2 column normed scores other elements: cent norm > scatter(pca.turtles) >
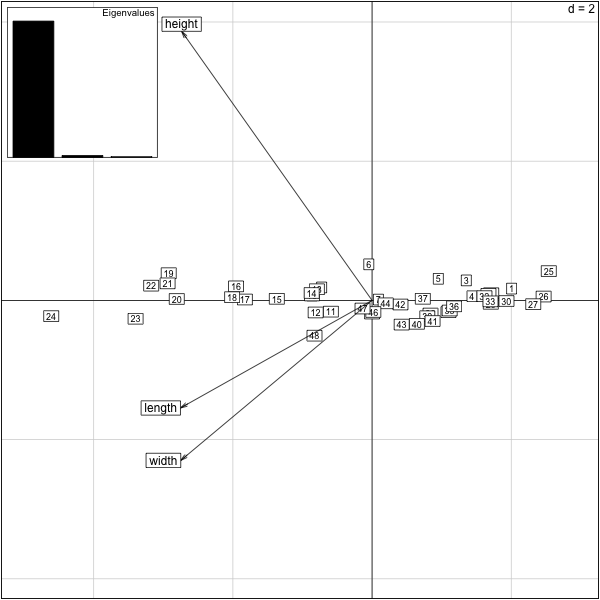
We can easily add in the discrete categorical sex’ variable with the ``s.class` function
������������������������������������������������������������������������������������������������������������������������������������������������������������������������������������������������������������������������������������������������������������������������������������������������������������������������������������������������������������������������������������������������������������������������������������������������������������������������������������������������������������������������������������������������������������������������������������������������������������������������������������������������������������������������������������������������������������������������������������������������������������������������������������������������������������������������������������������������������������������������������������������������������������������������������������������������������������������������������������������������������������������������������������������������������������������������������������������������������������������������������������������������������������������������������������������������������������������������������������������������������������������������������������������������������������������������������������������������������������������������������������������������������������������������������������������������������������������������������������������������������������������������������������������������������������������������������������������������������������������������������������������������������������������������������������������������������������������������������������������������������������������������������������������������������������������������������������������������������������������������������������������������������������������������������������������������������������������������������������������������������������������������������������������������������������������������������������������������������������������������������������������� > s.class(pca.turtles$li,factor(Turtles[,1])) >
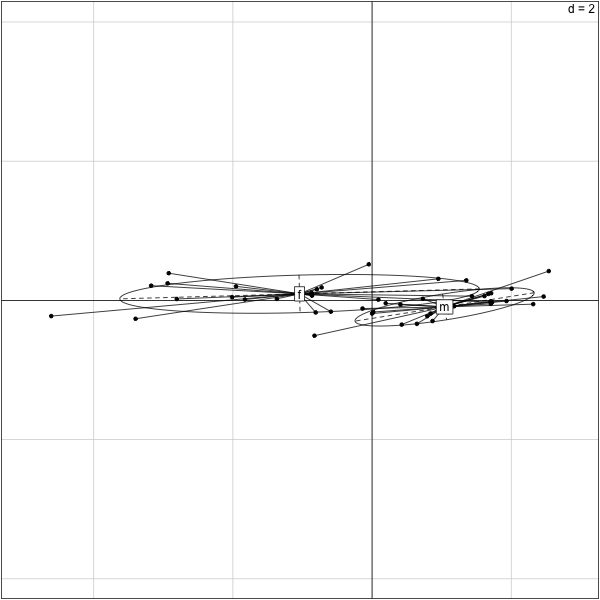
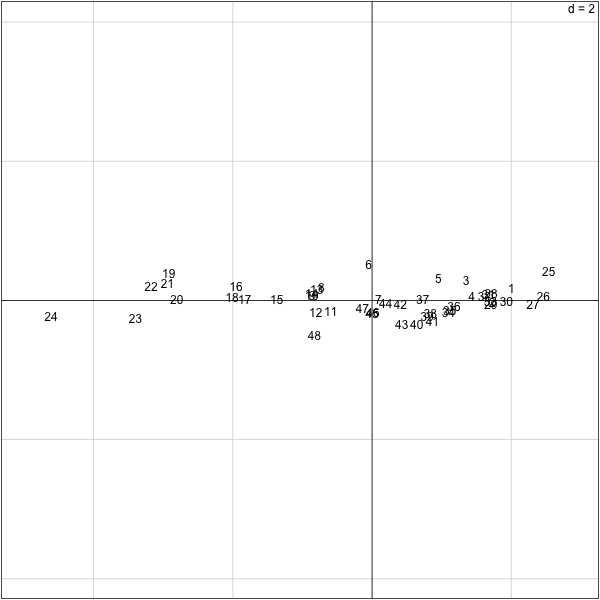
We can interpret the first component as the overall size of the turtles. We see that overall the females are smaller than the males. If we only look at the id numbers of the turtles down the list we notice a double pattern. What is it?
������������������������������������������������������������������������������������������������������������������������������������������������������������������������������������������������������������������������������������������������������������������������������������������������������������������������������������������������������������������������������������������������������������������������������������������������������������������������������������������������������������������������������������������������������������������������������������������������������������������������������������������������������������������������������������������������������������������������������������������������������������������������������������������������������������������������������������������������������������������������������������������������������������������������������������������������������������������������������������������������������������������������������������������������������������������������������������������������������������������������������������������������������������������������������������������������������������������������������������������������������������������������������������������������������������������������������������������������������������������������������������������������������������������������������������������������������������������������������������������������������������������������������������������������������������������������������������������������������������������������������������������������������������������������������������������������������������������������������������������������������������������������������������������������������������������������������������������������������������������������������������������������������������������������������������������������������������������������������������������������������������������������������������������������������������������������������������������������������������������������������������������������������������������������������������������������������������������������������������������������������������������������������������������������������������������������������� > s.label(pca.turtles$li,boxes=F) > Turtles[c(20:29,45:48),] sex length width height 20 f 155 117 60 21 f 158 115 62 22 f 159 118 63 23 f 162 124 61 24 f 177 132 67 25 m 93 74 37 26 m 94 78 35 27 m 96 80 35 28 m 101 84 39 29 m 102 85 38 45 m 127 96 45 46 m 128 95 45 47 m 131 95 46 48 m 135 106 47 >
R code for cut and paste
library(ade4)
data(olympic)
attach(olympic)
#Turtles=read.table("http://stats366.stanford.edu/data/PaintedTurtles.txt",header=TRUE)
   Turtles=read.table("/Users/susan/sphinx/data/PaintedTurtles.txt",header=T)
   turtlem=Turtles[,2:4]
   save(Turtles,file="Turtles.save")
   save(turtlem,file="turtlem.save")
   apply(turtlem,2,summary)
   round(cor(turtlem),1)
   round(cov(turtlem),2)
   turtlesc=scale(turtlem)
   round(cov(turtlesc),2)
require(ade4)
load("turtlem.save")
pca.turtles = dudi.pca(turtlem,scannf=F,nf=2)
print(pca.turtles)
scatter(pca.turtles)
s.class(pca.turtles$li,factor(Turtles[,1]))
s.label(pca.turtles$li,boxes=F)
Turtles[c(20:29,45:48),]
Decathlon Data
>    require(ade4)
>    data(olympic)
>    apply(olympic$tab,2,summary)
          100  long  poid  haut   400   110  disq  perc  jave  1500
Min.    10.62 6.220 10.27 1.790 47.44 14.18 34.36 4.000 49.52 256.6
1st Qu. 11.02 7.000 13.15 1.940 48.34 14.72 39.08 4.600 55.42 266.4
Median  11.18 7.090 14.12 1.970 49.15 15.00 42.32 4.700 59.48 272.1
Mean    11.20 7.133 13.98 1.983 49.28 15.05 42.35 4.739 59.44 276.0
3rd Qu. 11.43 7.370 14.97 2.030 49.98 15.38 44.80 4.900 64.00 286.0
Max.    11.57 7.720 16.60 2.270 51.28 16.20 50.66 5.700 72.60 303.2
>    print(round(cov(olympic$tab),2))
       100  long  poid  haut   400   110  disq  perc  jave   1500
100   0.06 -0.04 -0.07  0.00  0.16  0.08 -0.04 -0.03 -0.09   0.87
long -0.04  0.09  0.06  0.01 -0.17 -0.07  0.05  0.04  0.30  -1.64
poid -0.07  0.06  1.77  0.02  0.13 -0.20  3.99  0.21  4.38   4.89
haut  0.00  0.01  0.02  0.01 -0.01 -0.01  0.05  0.01  0.06  -0.15
400   0.16 -0.17  0.13 -0.01  1.14  0.30  0.57 -0.11  0.71   8.58
110   0.08 -0.07 -0.20 -0.01  0.30  0.26 -0.21 -0.09 -0.17   0.99
disq -0.04  0.05  3.99  0.05  0.57 -0.21 13.83  0.43  9.05  20.43
perc -0.03  0.04  0.21  0.01 -0.11 -0.09  0.43  0.11  0.50  -0.14
jave -0.09  0.30  4.38  0.06  0.71 -0.17  9.05  0.50 30.21   7.23
1500  0.87 -1.64  4.89 -0.15  8.58  0.99 20.43 -0.14  7.23 186.52
>    print(round(apply(olympic$tab,2,var),1))
  100  long  poid  haut   400   110  disq  perc  jave  1500
  0.1   0.1   1.8   0.0   1.1   0.3  13.8   0.1  30.2 186.5
>    print(round(cor(olympic$tab),1))
      100 long poid haut  400  110 disq perc jave 1500
100   1.0 -0.5 -0.2 -0.1  0.6  0.6  0.0 -0.4 -0.1  0.3
long -0.5  1.0  0.1  0.3 -0.5 -0.5  0.0  0.3  0.2 -0.4
poid -0.2  0.1  1.0  0.1  0.1 -0.3  0.8  0.5  0.6  0.3
haut -0.1  0.3  0.1  1.0 -0.1 -0.3  0.1  0.2  0.1 -0.1
400   0.6 -0.5  0.1 -0.1  1.0  0.5  0.1 -0.3  0.1  0.6
110   0.6 -0.5 -0.3 -0.3  0.5  1.0 -0.1 -0.5 -0.1  0.1
disq  0.0  0.0  0.8  0.1  0.1 -0.1  1.0  0.3  0.4  0.4
perc -0.4  0.3  0.5  0.2 -0.3 -0.5  0.3  1.0  0.3  0.0
jave -0.1  0.2  0.6  0.1  0.1 -0.1  0.4  0.3  1.0  0.1
1500  0.3 -0.4  0.3 -0.1  0.6  0.1  0.4  0.0  0.1  1.0
>
Now we do a PCA using the variance covariance cross product matrix:
������������������������������������������������������������������������������������������������������������������������������������������������������������������������������������������������������������������������������������������������������������������������������������������������������������������������������������������������������������������������������������������������������������������������������������������������������������������������������������������������������������������������������������������������������������������������������������������������������������������������������������������������������������������������������������������������������������������������������������������������������������������������������������������������������������������������������������������������������������������������������������������������������������������������������������������������������������������������������������������������������������������������������������������������������������������������������������������������������������������������������������������������������������������������������������������������������������������������������������������������������������������������������������������������������������������������������������������������������������������������������������������������������������������������������������������������������������������������������������������������������������������������������������������������������������������������������������������������������������������������������������������������������������������������������������������������������������������������������������������������������������������������������������������������������������������������������������������������������������������������������������������������������������������������������������������������������������������������������������������������������������������������������������������������������������������������������������������������������������������������������������������������������������������������������������������������������������������������������������������������������������������������������������������������������������������������������������������������� > require(ade4) > data(olympic) > pca.olympic = dudi.pca(olympic$tab,scale=F,scannf=F,nf=2) > scatter(pca.olympic) >
Here are the variables
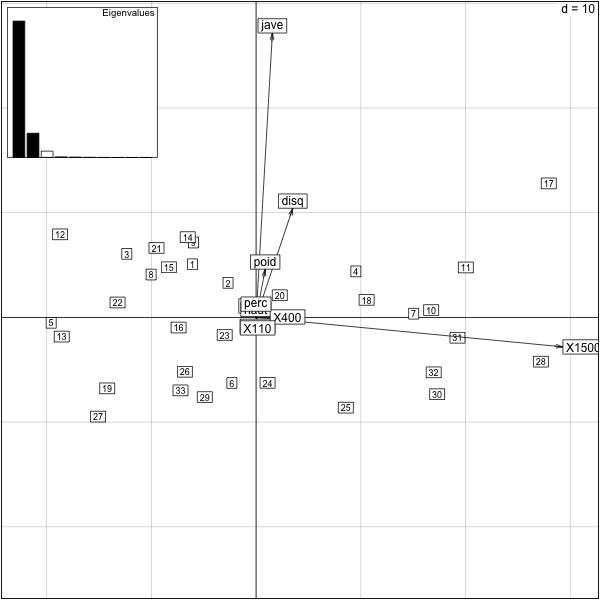
���������������������������������������������������������������������������������������������������������������������������������������������������������������������������������������������������������������������������������������������������������������������������������������������������������������������������������������������������������������������������������������������������������������������������������������������������������������������������������������������������������������������������������������������������������������������������������������������������������������������������������������������������������������������������������������������������������������������������������������������������������������������������������������������������������������������������������������������������������������������������������������������������������������������������������������������������������������������������������������������������������������������������������������������������������������������������������������������������������������������������������������������������������������������������������������������������������������������������������������������������������������������������������������������������������������������������������������������������������������������������������������������������������������������������������������������������������������������������������������������������������������������������������������������������������������������������������������������������������������������������������������������������������������������������������������������������������������������������������������������������������������������������������������������������������������������������������������������������������������������������������������������������������������������������������������������������������������������������������������������������������������������������������������������������������������������������������������������������������������������������������������������������������������������������������������������������������������������������������������������������������������������������������������������������������������������������������������������������������������������������������������������������������������������������������������������������������������������������������������������������������������������������������������������������������������������������������������������������������������������� > s.label(pca.olympic$co,boxes=F) >
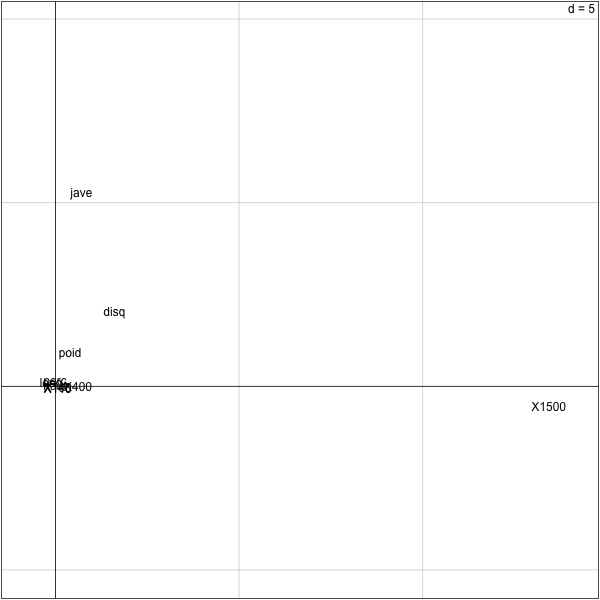
From this plot, we see that the first principal component is positively associated with longer times on the 1500. So, slower runners will have higher value on this component.
> cor(olympic$tab[,'1500'],pca.olympic$li[,1])
[1] 0.9989881
>
The first principal component is negatively correlated to the javelin variable. The second principal component is positively associated with the javelin variable.
> cor(olympic$tab[,'jave'],pca.olympic$li[,2])
[1] 0.9690664
> cor(olympic$tab[,'jave'],pca.olympic$li[,1])
[1] 0.1317421
>
   require(ade4)
   data(olympic)
   apply(olympic$tab,2,summary)
   print(round(cov(olympic$tab),2))
   print(round(apply(olympic$tab,2,var),1))
   print(round(cor(olympic$tab),1))
require(ade4)
data(olympic)
pca.olympic = dudi.pca(olympic$tab,scale=F,scannf=F,nf=2)
scatter(pca.olympic)
s.label(pca.olympic$co,boxes=F)
cor(olympic$tab[,'1500'],pca.olympic$li[,1])
cor(olympic$tab[,'jave'],pca.olympic$li[,2])
cor(olympic$tab[,'jave'],pca.olympic$li[,1])
Standardizing
In the previous example, we saw that the two variables were based somewhat on speed and strength. However, we did not scale the variables so the 1500 has much more weight than the 400, for instance. We correct this by rescaling the variables (this is actually the default in dudi.pca).
������������������������������������������������������������������������������������������������������������������������������������������������������������������������������������������������������������������� > pca.olympic = dudi.pca(olympic$tab,scale=T,scannf=F,nf=2) > scatter(pca.olympic) >
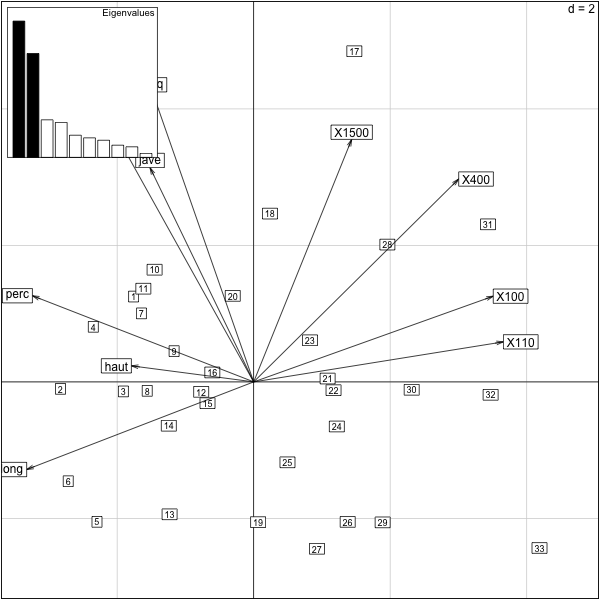
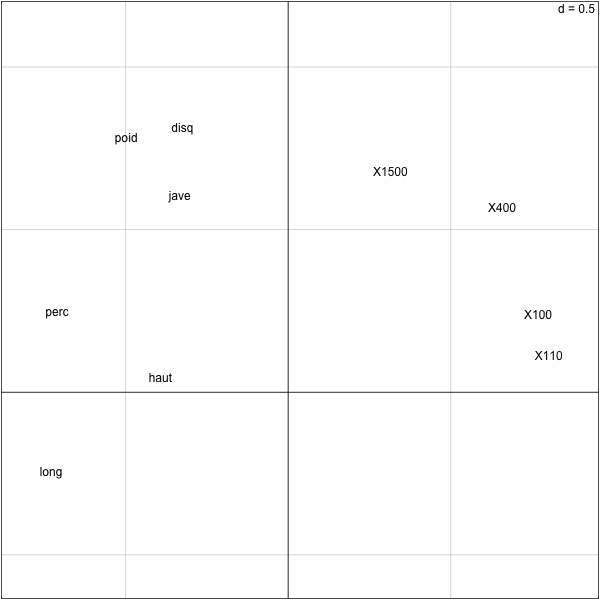
This plot reinforces our earlier interpretation and has put the running events on an “even playing field” by standardizing.
������������������������������������������������������������������������������������������������������������������������������������������������������������������������������������������������������������������������������������������������������������������������������������������������������������������������������������������������������������������������������������������������������������������������������������������������ > require(ade4) > pca.olympic = dudi.pca(olympic$tab,scale=T,scannf=F,nf=2) > s.label(pca.olympic$co,boxes=F) >
> require(ade4)
> pca.olympic = dudi.pca(olympic$tab,scannf=F,nf=2)
> cor(olympic$tab[,'1500'],pca.olympic$li[,1])
[1] 0.3145678
> cor(olympic$tab[,'jave'],pca.olympic$li[,2])
[1] 0.6004996
> cor(olympic$tab[,'jave'],pca.olympic$li[,1])
[1] -0.3326883
>
pca.olympic = dudi.pca(olympic$tab,scale=T,scannf=F,nf=2)
scatter(pca.olympic)
   require(ade4)
   pca.olympic = dudi.pca(olympic$tab,scale=T,scannf=F,nf=2)
   s.label(pca.olympic$co,boxes=F)
require(ade4)
pca.olympic = dudi.pca(olympic$tab,scannf=F,nf=2)
cor(olympic$tab[,'1500'],pca.olympic$li[,1])
cor(olympic$tab[,'jave'],pca.olympic$li[,2])
cor(olympic$tab[,'jave'],pca.olympic$li[,1])
More meaningful variables and Overall score
We replace the times with their opposites so as the values increase performance increases.
������������������������������������������������������������������������������������������������������������������������������������������������������������������������������������������������������������������������������������������������������������������������������������������������������������������������������������������������������������������
> olympic2=olympic$tab
> olympic2[,c(1,5,6,10)]=-olympic2[,c(1,5,6,10)]
> pca.olympic2=dudi.pca(olympic2,nf=2,scannf=F)
> s.label(pca.olympic2$co,boxes=F)
> round(cor(olympic2),2)
      100 long  poid haut   400  110  disq perc  jave  1500
100  1.00 0.54  0.21 0.15  0.61 0.64  0.05 0.39  0.06  0.26
long 0.54 1.00  0.14 0.27  0.52 0.48  0.04 0.35  0.18  0.40
poid 0.21 0.14  1.00 0.12 -0.09 0.30  0.81 0.48  0.60 -0.27
haut 0.15 0.27  0.12 1.00  0.09 0.31  0.15 0.21  0.12  0.11
400  0.61 0.52 -0.09 0.09  1.00 0.55 -0.14 0.32 -0.12  0.59
110  0.64 0.48  0.30 0.31  0.55 1.00  0.11 0.52  0.06  0.14
disq 0.05 0.04  0.81 0.15 -0.14 0.11  1.00 0.34  0.44 -0.40
perc 0.39 0.35  0.48 0.21  0.32 0.52  0.34 1.00  0.27  0.03
jave 0.06 0.18  0.60 0.12 -0.12 0.06  0.44 0.27  1.00 -0.10
1500 0.26 0.40 -0.27 0.11  0.59 0.14 -0.40 0.03 -0.10  1.00
>
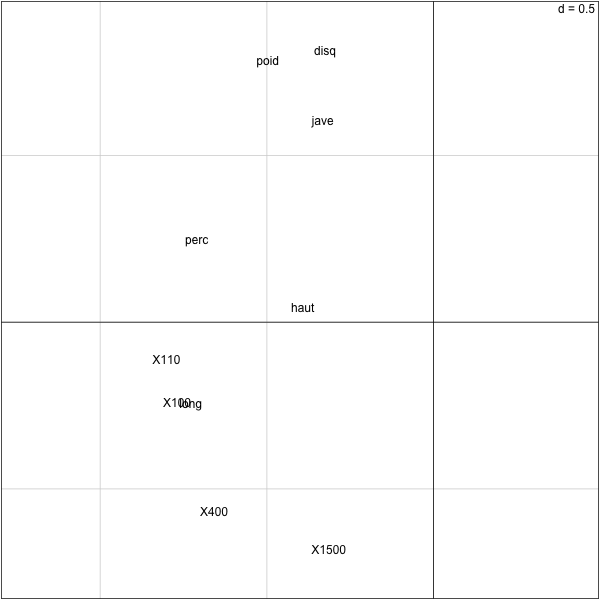
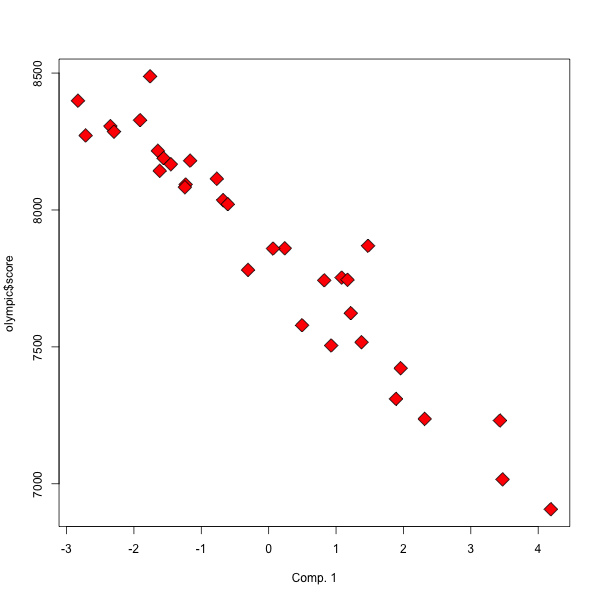
Now we can see that the olympic score is very (negatively) correlated to the first component
����������������������������������������������������������������������������������������������������������������������������������������������������������������������������������������������������������������������������������������������������������������������������������������������������������������������������������������������������������������������������������������������������������������������������������������������������������������������������������������������������������������������������������������������������������������������������������������������������������������������������������������������������������������������������������������������������������������������������������������������������������������������������������������������������������������������������������������������������������������������������������������������������������������������������������������������������������������������������������������������������������������������������������������������������������������������������������������������������������������������������������������������������������������������������������������������������������������������������������������������������������������������������������������������������������������������������������������������������������������������������������������������������������� > cor(pca.olympic2$li[,1],olympic$score) [1] -0.9615839 > plot(pca.olympic2$li[,1], olympic$score, xlab='Comp. 1', pch=23, bg='red' , cex=2) >
olympic2=olympic$tab
olympic2[,c(1,5,6,10)]=-olympic2[,c(1,5,6,10)]
pca.olympic2=dudi.pca(olympic2,nf=2,scannf=F)
s.label(pca.olympic2$co,boxes=F)
round(cor(olympic2),2)
  cor(pca.olympic2$li[,1],olympic$score)
  plot(pca.olympic2$li[,1], olympic$score, xlab='Comp. 1', pch=23, bg='red', cex=2)
