Polarization Selective IR Pump-Probe Experiments
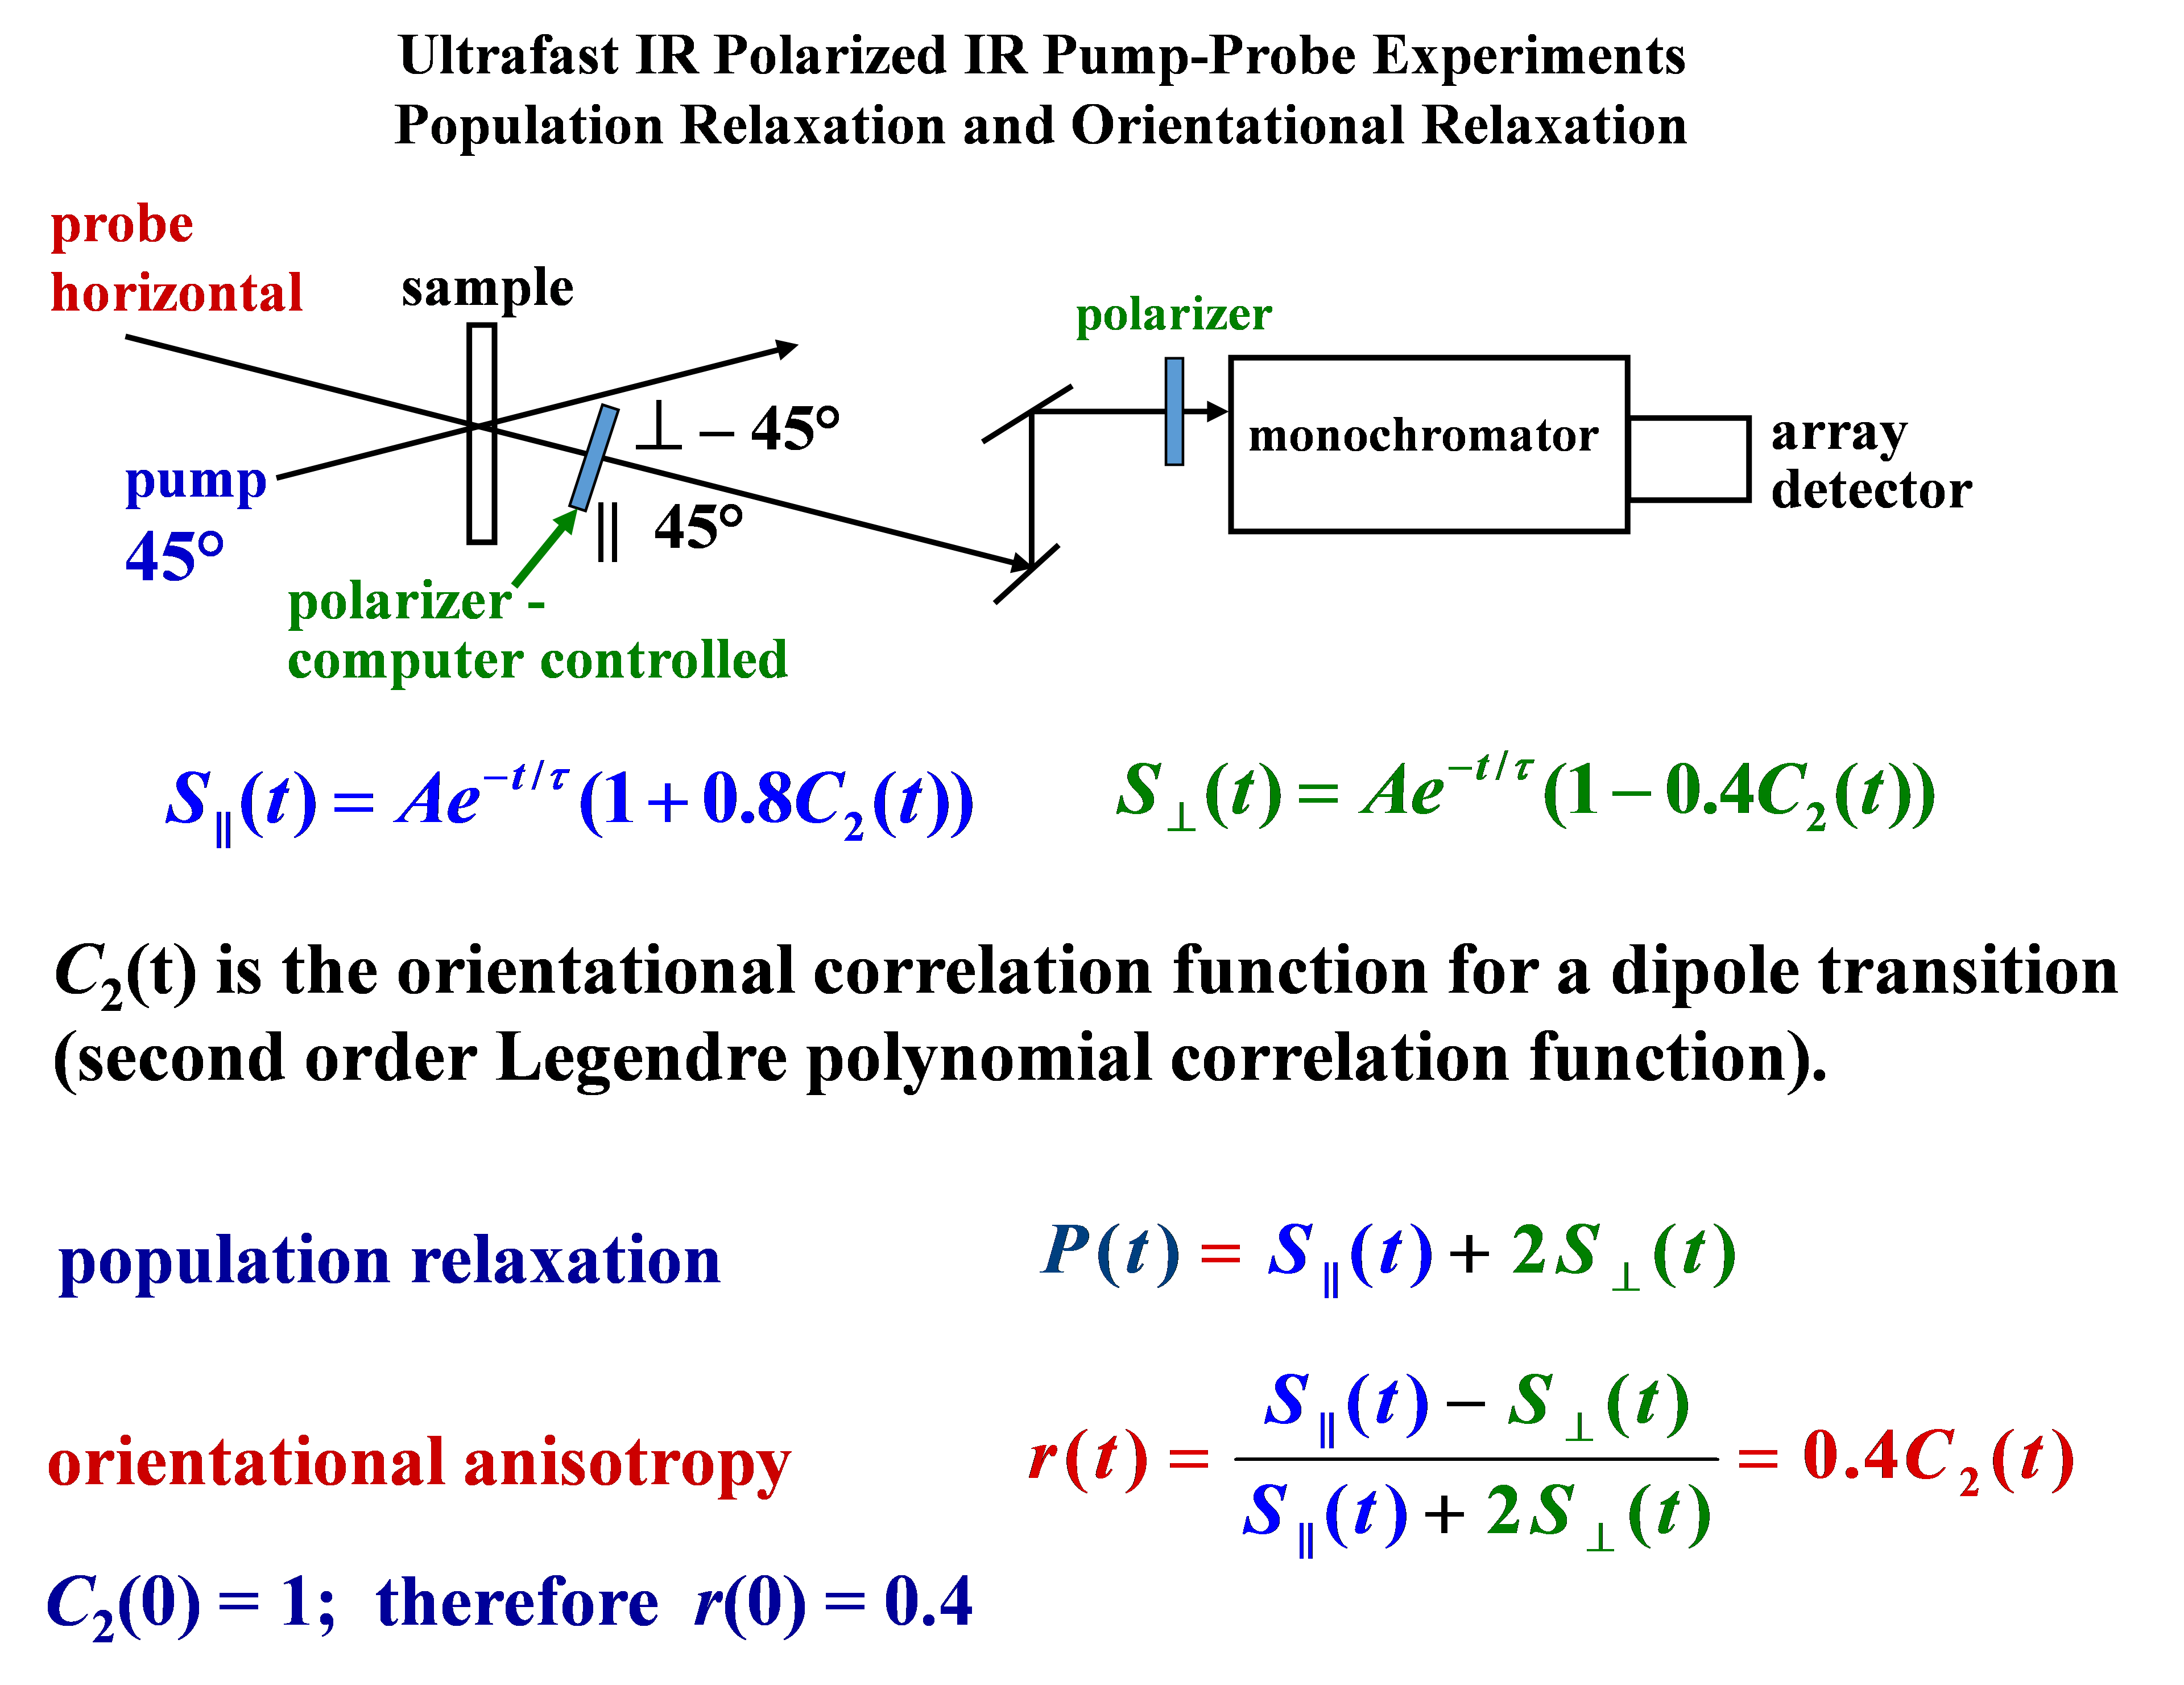
Vibrational lifetimes (population relaxation) and orientational relaxation (anisotropy decay) are measured as a function of wavelength using and polarization selective IR pump-probe experiments. The laser equipment is the same as used in a 2D IR experiment. However, only two pulses are used. The method is illustrated in the figure.

In the pump-probe experiment, two ultrashort pulses (~100 fs) of IR light, tuned to the frequency of the vibrational mode of interest, are directed into the sample. Because the IR pulses are very short they have a very broad spectrum. Therefore all of the vibrational oscillators can absorb the light. In the experiment, the first pulse, called the pump, excites some of the vibrations. A second pulse, the probe, is brought in so that it overlaps spatially in the sample with the volume excited by the pump. The probe is brought in at variable delay times after the pump. Without the pump, when the probe passes through the sample, some of it will be absorbed, so the transmitted pulse has less amplitude than the incident pulse. When the pump pulse precedes the probe pulse in time, some of the vibrations have been excited into the first vibrationally excited state. The excitation of the vibrations leaves fewer molecules in the ground state to absorb the probe, so the transmission of the probe is increased.
First consider what happens if the molecules that are vibrationally excited by the pump pulse cannot rotate. The vibrationally excited state has a finite lifetime. The excited state population created by the pump will decay to the ground (lowest) vibrational state. As the ground state is repopulated, the transmission of the delayed probe pulse will decrease because the absorption of the sample increases. The signal in the pump-probe experiment is the difference in the transmission of the probe with the pump on and with the pump off. As the probe delay is increased the signal decreases because of population relaxation, P(t). A plot of the signal vs. time delay of the probe will give the vibrational lifetime. The vibrational lifetime is very sensitive to the environment of the molecule of interest and can provide useful information. By selecting the appropriate polarizations of the pump and probe beams, it is possible to measure the vibrational lifetime even if the molecules are rotating (see Figure for equations).
In addition to population relaxation, the molecules rotate, which also affects the pump-probe signal. The pump pulse is polarized light, which results in more molecules being excited with their transition dipoles pointing along the pump polarization than perpendicular to it. At very short time, before the molecules have a chance to rotate, the increase of transmission of the probe pulse when its polarization is parallel to the pump pulse polarization is greater than when it is perpendicular. It can be shown that prior to orientational relaxation, the pump causes an increase in transmission for parallel probe polarization that is three times greater than for the perpendicular probe polarization. As time goes on, orientation relaxation will randomize the direction of all of the vibration transition dipoles. Molecules initially parallel to the pump polarization will have equal probability of pointing in any direction at long time, and molecules perpendicular to the pump polarization will also point in all directions at long time. In fact, molecules initially pointing in any direction will randomize their directions at long time. For a probe pulse with polarization parallel to the pump pulse, there will be a decay of the signal as initially excited molecules rotate to other directions and are replaced by molecules that are not excited. For the probe polarization perpendicular to the pump polarization, there will be an increase in signal as excited molecules rotate to the perpendicular direction. Therefore, it is possible to measure the rate of orientational relaxation by making two time dependent measurements, one with the probe parallel to the pump polarization and one with the probe perpendicular to the probe polarization. In addition to the time dependence from the rotations there is also the time dependent population relaxation.
When the polarized pump pulse first excites the sample, the sample has an anisotropic distribution of excited vibrations, that is, more are excited with their transition dipole vectors along the pump than perpendicular to it. As time goes on, the anisotropy decays because of the orientational motions. This orientational relaxation causes the anisotropy, r(t), to decay (see Figure for equations). Measuring the time dependent anisotropy gives r(t), which is directly related to the orientation relaxation time.
The figure is a simplified schematic of the experiment. Immediately after the sample is the analyzer polarizer, which is on a computer controlled rotation stage. The polarizer alternates between being parallel to the pump pulse (Spara) and being perpendicular to the pump pulse (Sperp), measuring the signals Spara and Sperp, respectively. Another polarizer is located just before the entrance slit of the monochromator. It is set at horizontal polarization so that regardless of the polarization passed by the analyzer polarizer, the monochromator always sees horizontal polarization. This is necessary because the grating diffraction efficiency is polarization dependent. It is necessary to measure the absolute amplitudes of Spara and Sperp. As shown in the figure, by taking the appropriate combinations of Spara and Sperp, the population relaxation and the orientational anisotropy decay can be determined.
Relevant Publications
328. “Polarization Selective Spectroscopy Experiments: Methodology and Pitfalls,” Howe-Siang Tan, Ivan R. Piletic and M. D. Fayer, J.O.S.A. B 22, 2009-2017 (2005).
386. “Water Dynamics in Large and Small Reverse Micelles: From Two Ensembles to Collective Behavior,” David E. Moilanen, Emily E. Fenn, Daryl Wong, and M. D. Fayer J. Chem. Phys. 131, 014704 (2009).
443. “Separation of Experimental 2D IR Frequency-Frequency Correlation Functions into Structural and Reorientation-induced Contributions,” Patrick L. Kramer, Jun Nishida, and Michael D. Fayer J. Chem. Phys. 143, 124505 (2015).
