2D IR Spectroscopy in the Pump-Probe Geometry using AOM Pulse Shaping
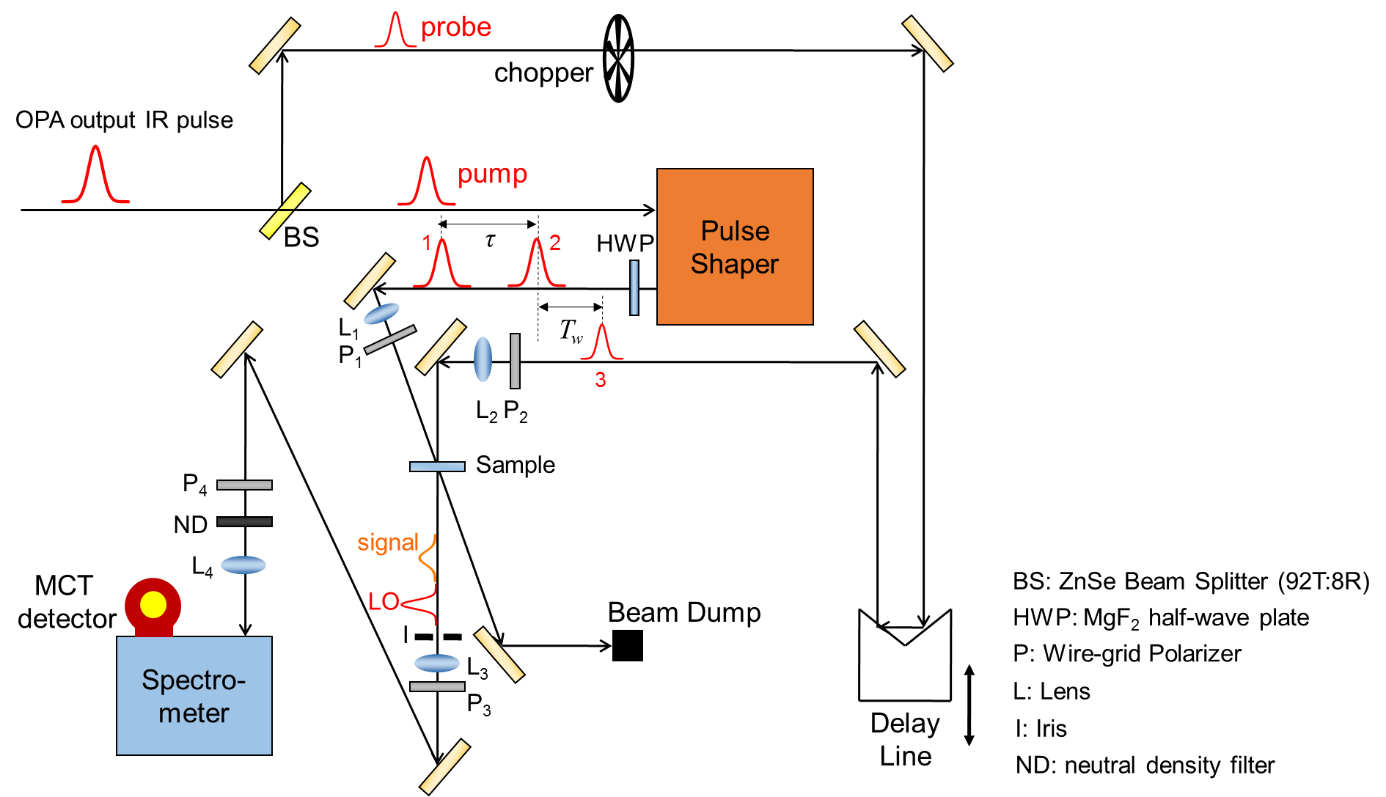
2D IR spectroscopy can be implemented using an acousto-optic modulator (AOM) pulse shaper as well (Figure 1). The laser systems are similar to the one shown schematically in the BoxCARS section. However, our latest system has a regen output of 2 mJ at 3 kHz, and the OPA makes tens of μJ in the mid-IR. The mid-IR output of the OPA is split into a strong “pump” pulse and a weak “probe” pulse.

Figure 1: 2DIR spectrometer diagram in the pump-probe geometry
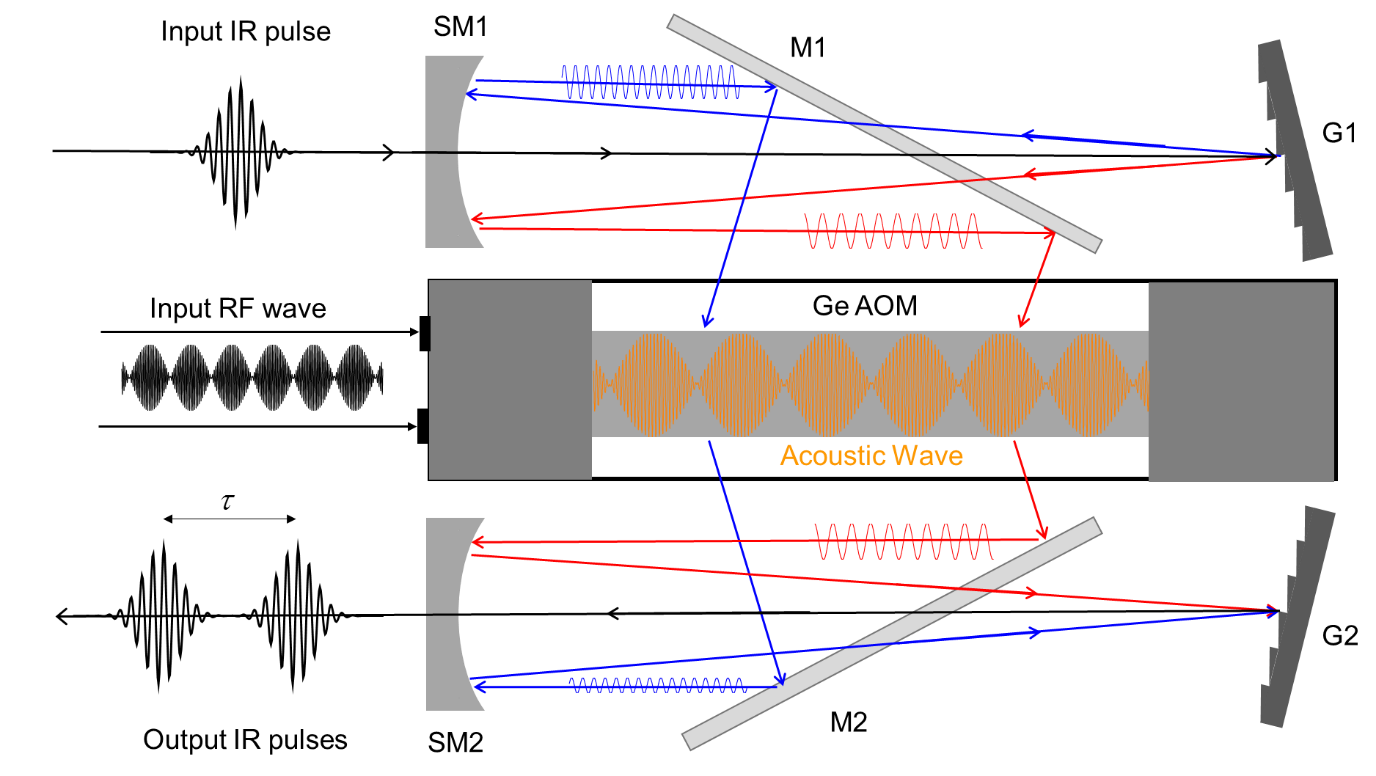
The pump pulse is sent into the AOM pulse shaper (Figure 2) to generate two pump pulses, which are collinearly propagating but temporarily separated by time τ. The pump beam passes over the top of the spherical mirror (SM1) and hits the grating (G1), which is angled slightly down. After diffraction from the grating, the pulse is dispersed in wavelength, and the rays hit the spherical mirror (SM1) and are now collimated. They are intercepted by the mirror M1, and directed into the germanium acousto-optic modulator (AOM).
An arbitrary waveform generator (AWG) is used to generate a complex “wave” that is fed into a high powered RF amplifier, which drives the AOM piezo-electric transducer (PZT). The PZT produces an acoustic wave that mimics the wave generated by the AWG. Here is the heart of the pulse shaping method. The incoming beam is a Gaussian pulse with a broad spectral bandwidth. The grating and spherical mirror separates the different wavelengths into rays that are parallel and go into the AOM. The different IR colors interact with different parts of the acoustic wave. By controlling the acoustic wave’s amplitude and phase at each spatial position along the AOM, the amplitude and phase of each IR color can be controlled as the IR light diffracts off of the complex acoustic diffraction grating. The IR emerging from the AOM hits mirror M2, spherical mirror SM2, and the grating G2. This spatially reassembles the rays into wave packets that have essentially the same spatial characteristics as the single incoming pulse.
In 2D IR experiments, the pulse shaper is used to turn the single incoming Gaussian pulse into two Gaussian (or any shape) pulses with controllable time separation and phase. The two pulses emerge collinearly from the AOM. Here is how this works. Say you wanted two Gaussian pulses separated by 1 ps. Take the Fourier transform of this double Gaussian into the frequency domain. This will give you the amplitude and phase of each IR frequency in the double Gaussian. We can program the AWG to produce an RF signal that generates the acoustic wave needed to set the amplitude and phase of each IR frequency diffracted by the AOM such that a double Gaussian emerges with separation 1 ps.

Figure 2: AOM pulse shaper
The two pump pulses from the pulse shaping system separated by time τ are then focused into the sample. After an additional time Tw, the probe pulse crosses the sample to generate the vibrational echo signal. Because the first two pulses are collinear, the vibrational echo signal propagates collinearly with the probe pulse as a consequence of phase matching. As a result, the probe pulse can be used as a local oscillator (LO) to extract the phase of the vibrational echo signal.
2D IR spectroscopy implemented in the above pump-probe geometry has several significant advantages over the conventional setup with the BoxCARS geometry:
- There is less ambiguity in the phase relationship between the incident and emitted pulses, and the purely absorptive 2D spectrum of interest can be directly acquired without post data processing.
- The AOM provides rigorous control over the phase relationship between the first two pulses so that “phase cycling” can be used to change the phase of each pump pulse every laser shot. The two pulses’ phase can be set as either (0, 0) or (0, π). When the relative phase between the first and second pulse is flipped by π, the echo signal’s phase is flipped by π relative to the local oscillator, whose phase remains fixed. This means that the sign of the signal flips. Thus, by subtracting the signal obtained with relative phase (0, π) from that obtained with (0, 0), the background LO is eliminated and the signal can be extracted. As a result, the background-free signal can be obtained without the need to chop a beam as in the BoxCARS geometry.
- When the phase cycling scheme is made more complicated, as in 4 shots phase cycling, it can eliminate major scattering artifacts from samples. When phase cycling is further combined with polarization filtering and chopping of the probe beam, scattering artifacts can be completely removed even from fine particle samples with vast amounts of scatter.
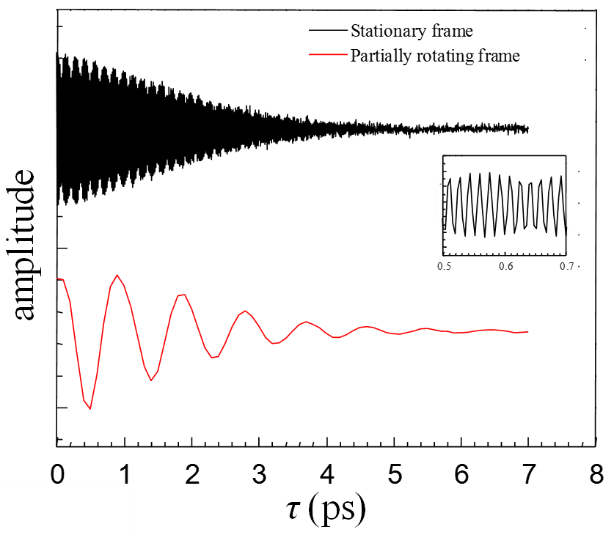
- The time separation τ between the first and the second pulses can be altered every shot, and thus a single interferogram can be acquired much faster (>100 times) than with the BoxCARS geometry. This feature greatly reduces noise from long-term instability in the laser light source when the signal is averaged. Also, the experiment can be implemented in a “partially rotating” frame, which greatly reduces the number of data points required to complete an interferogram. This accelerates the data acquisition rate by another significant factor. Data acquisition in a partially rotating frame involves shifting the relative phase between the first two pulses as τ is scanned, which is made possible by the accurate phase control provided by the AOM pulse shaper. In Figure 3, two interferograms for RePhen(CO)3Cl dissolved in CHCl3 are shown. The top one is measured in the conventional stationary frame, while the bottom one is measured in a partially rotating frame. In the top interferogram, the data must be acquired every 3 fs along the τ axis. In the bottom interferogram, a τ point is taken every 60 fs. Thus, the number of data points required for the same information is reduced by a factor of 20. The procedure to obtain a 2D spectrum from an interferogram using the Fourier transform is discussed in detail in the BoxCARS section. One caveat is that because the measurement is done in a partially rotating frame, the frame frequency must be taken into account to obtain an ωτ axis with the correct scale.
- If necessary, the spectrum of the pump pulses can be easily altered by playing with the acoustic waveform, albeit at the expense of temporal resolution and/or the energy of the pulses. This feature is useful in case only one vibrational mode of interest needs to be studied, and the experimenter wants to prevent nearby coupled modes from being coherently pumped.

Figure 3: An example of interferograms taken with stationary frame (top) and the partially rotating frame.
The procedure used to generate IR pulses in the pump-probe geometry is, in principle, the same as that used in the BoxCARS geometry. The 800 nm output from a regenerative amplifier pumps an optical parametric amplifier (OPA) to yield two near-infrared (NIR) pulses with different frequencies. When these two NIR pulses are collinearly sent into an AgGaS2 crystal, the mid-infrared pulse is generated as the difference frequency between the two pulses.
We currently implement two 2DIR spectrometers in the pump-probe geometry. One of them uses a standard 700 μJ, 1 kHz regenerative amplifier output to pump an OPA, which yields a 7-9 μJ mid-infrared pulse. We recently developed another system with a high power regenerative amplifier (2 mJ, 3 kHz). We designed and develop the OPA to accommodate this strong output from the regenerative amplifier, and obtained a 30-40 μJ mid-infrared pulse. This high power and high repetition rate output significantly accelerates our data acquisition rate and allows us to study samples with extremely weak transition dipoles.
Relevant Publications
420. "Comparisons of 2D IR Measured Spectral Diffusion in Rotating Frames Using Pulse Shaping and in the Stationary Frame Using the Standard Method," S. K. Karthick Kumar, A. Tamimi, and M. D. Fayer J. Chem. Phys. 137, 184201 (2012).
437. "Structural Dynamics inside a Functionalized Metal-Organic Framework Probed by Ultrafast 2D IR Spectroscopy," Jun Nishida, Honghan Fei, Amr Tamimi, Sonja Pullen, Sascha Ott, Seth M. Cohen, and Michael D. Fayer Proc. Nat. Acad. Sci. U.S.A. 111, 18442-18447 (2014).
