Lecture 14: Ethics and Drawing
July 14th, 2021
Today: function call parameter detail, Canvas drawing, draw functions, drawing a grid
Function Call - Variables and Parameters
How do function call parameters work? Mostly, you do not need to think about this and your code will work fine. However, I'm going to walk through the details here once so you see the rules.
There are two rules to keep in mind.
1. Function Variables are Independent
The variables and parameters in each function are independent, sealed off from those in other functions By default, an "x" in one function is independent of an "x" in some other function, even though they have the same name.
Giving each function its own variables is sensible. If it did not work that way. Variables inside functions could interfere with each other. Suppose a programmer is working on a function and uses a "total" variable. Then if another function somewhere else in the program also happened to choose the name "total" for a variable, now we have a problem where the two "total" variables interfere with each other? That would be very hard to keep straight. Therefore, the default behavior is that variables introduced in each function are independent and sealed off from the variables in other functions, even if they have the same name. This also fits with the "black box" design, trying to keep each function independent and sealed-off from its environment.
2. Function Call Parameters -
Match By Position, Not Name
For a function call, the parameter values come from the call-line by position not name. Say we have this foo() function:
def foo(x, y):
   ...


# Later code calling foo()
foo(6, 12)
When foo() is called, the parameter x gets its value from the first value within the parenthesis on the call line, e.g. 6. The y parameter gets its value from the second value within the parenthesis, e.g. 12.
Function Call Example
Say we have a "foo" function with 2 parameters, and it is called by a "caller" function later. What does the run of caller() below print? This is very detail oriented, but mercifully there's just a few lines.
def foo(x, y):
    x = x - y
    return x + 1


def caller():
    x = 2
    y = 4
    y = foo(8, x)
    print(x, y)
1. Before foo() is called
See how foo() and caller() have their own variables. The action begins as the caller() function runs, setting its variables to 2 and 4.

2. foo() is Called - What are x and y?
The x and y parameters of foo get their values by position on the line that calls foo() - getting 8 and 2. The code in foo() runs, returning 7. Changing the x here does not affect the x down in caller().

3. foo() returns, back in caller()
The function call to foo() returns 7, code runs in caller(). What does it print?

Solution
printed line:
2 7
foo() y = 13?
What if we said y = 13 up in foo()? Would that change the output? No. Each function has its own "y", that would just change the "y" variable that is inside foo().
Experiment: Try In Interpreter
It is unusual to write a def in the >>> interpreter, but here it's a live way to see the independence of vars, and that parameters match up by position.
>>> # 1. define foo(), it has its own "x" and "y"
>>> def foo(x, y):
...   x = x - y
...   return x + 1
...
>>>
>>> # 2. set variable "x" here, separate from "x" above.
>>> # Then call foo(), what is printed?
>>> x = 6
>>> y = foo(10, x)
>>> print(x, y)
???
What is printed? The variable x is still 6, since it is different from the x in foo(), so "6 5" is printed.
Now For Something Different
Drawing lines and rectangles on screen. This is a realistic thing many programs need to do. It's also a neat way experiment with math in your code with visual results.
Applied Math
How much math do you need for CS? Today we'll have some really nice applied math. Mostly just addition and multiplication, but using variables like i and width in the code, and you need to form a mental model of how those numbers and formulas map to what you see on screen.
It will be tricky at times, but you will be able to see how variables and formulas in python map to real results on screen.
Recall - % Even Odd
A simple use of modulo is checking if a number is even or odd - n % 2 is 0 if n is even, 1 if odd.
>>> 8 % 2
0
>>> 9 % 2
1
>>> 10 % 2
0
>>> 11 % 2
1
Download draw1 Example Project
This is a big example program that draws on screen for today. Expand the .zip to get a "draw1" folder with .py files in it. Run PyCharm. Use Open... menu to open the *folder*
Drawing on a Canvas
Draw Canvas Functions
We'll use the CS106A "DrawCanvas" which supports these functions:
    def draw_line(x1, y1, x2, y2):
        """
        Draws a black line between points x1,y1 and x2,y2
        Optional color='red' parameter can specify a color.
        """

    def draw_rect(x, y, width, height):
        """
        Draws a 1 pixel rectangle frame with its upper left at x,y
        and covering width, height pixels.
        Takes optional color='red' parameter.
        """

    def fill_rect(x, y, width, height):
        """
        Draws a solid black rectangle with its upper left at x,y
        and covering width, height pixels.
        Takes optional color='red' parameter.
        """

    def draw_oval(x, y, width, height):
        """
        Draws a 1 pixel oval frame with its upper left bounding rect at x,y
        and covering width, height pixels.
        Takes optional color='red' parameter.
        """

    def fill_oval(x, y, width, height):
        """
        Draws a solid black oval with its upper left bounding rect at x,y
        and covering width, height pixels.
        Takes optional color='red' parameter.
        """

    def draw_string(x, y, text):
        """
        Draws a black text string with its upper left at x,y
        Takes optional color='red' parameter.
        """
Calling Canvas Functions
These are noun.verb functions on a Canvas like this:
# Create a 500x300 canvas, draw a red line on it
canvas = DrawCanvas(500, 300)
canvas.draw_line(0, 0, 100, 100, color='red')
...
Note: float Values are Fine For Drawing
Indexing to access a char in a string or an element in a list - need to use int.
However this on-screen drawing, float values are fine - internally it just drops the fractional part - e.g. below just truncates to 100,150.
canvas.draw_line(0, 0, 100.3, 150.9)
The pixels are so small on screen, it's hard to tell the difference between x=100 and x=101.
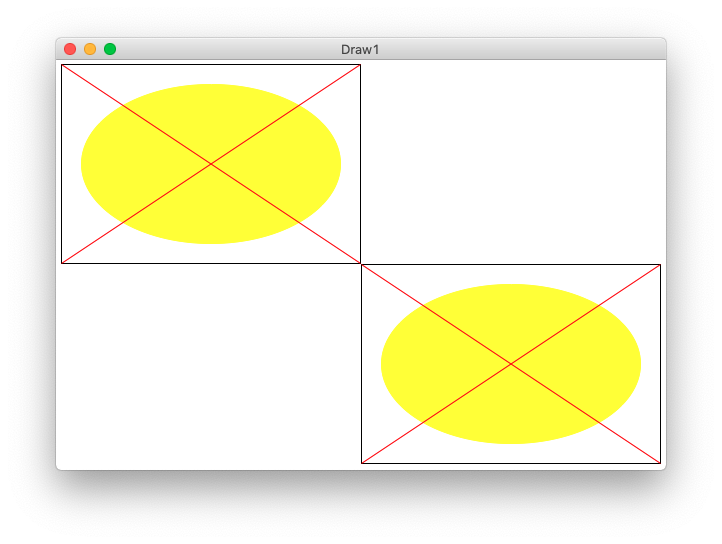
Example 1 - draw_oval()
We'll start with the "oval" figure - it has a black rectangle at its outer boundary. Then a yellow oval inset by 20 pixels on 4 sides. Then 2 red lines making a big X from upper-left to lower-right, and upper-right to lower-left. We'll use this as a first example to think about coordinates.
Running the program draws 2 copies of the figure - one upper-left, one lower-right, which helps with testing. Here is the output of the program, showing the upper-left and lower-right copies of the figure. Each figure is drawn by one call to the draw_oval() function below.
Running from the command line looks like this:
$ python3 draw1.py -oval 500 300
draw_oval(canvas, left, top, width, height)
The draw_oval() functions draws one copy of the figure on the canvas. The size and position of the figure is determined by the parameters passed into draw_oval() - the figure is positioned at the given left,top parameters, with its size given by width,height parameters.
- Parameters left, top are the coords of the upper left pixel of the figure
- Parameters width height are the size of figure in pixels
draw_oval() - Position? Size?
Q1: What is the x,y of the upper left pixel of the imaginary rectangle around the inset oval?
Q2: What is the width,height size of the inset oval?

A1: left,top are the coords of the figure itself. The coords of the inset oval are
left + 20, top + 20
A2: The width of the inset oval is (width - 40), since the oval loses 20 pixels on its left side, and also 20 pixels on its right side. Likewise its height is(height - 40)
draw_oval() - fill_oval() call
Here is the line of python code to draw that oval by calling the fill_oval() function, doing the math to specify the location and size of the inset oval.
def draw_oval(canvas, left, top, width, height):
    ...
    canvas.fill_oval(left + 20, top + 20,
                     width - 40, height - 40,
                     color='yellow')
What is that code saying? The parameter left holds the x value for the overall figure. The code can pass the expression left + 20 as the x value for the inset oval.
This is classic parameter-using code - we do not know exactly what number we are running with. But writing the code, we just use the parameters, trusting that the right value is in there.
Note: also this shows a PEP8 style approved way to call a function with a lot of parameters, the second and later lines are indented to match the first. Just writing it all on one line is fine too.
draw_oval() - Coordinates of corners?
Q1: What is the coordinate of the upper-left corner pixel of the figure? It's not (0,0), that's the coordinate of the upper left corner of the whole screen. The coordinate of the upper left of the figure is
`left, top`
We'll use some real numbers to think about this math, say left, top is 100,50. Say width,height is 100, 50.

This is a little tricky.
Q2: What is the coordinate of the upper-right corner pixel of the figure?
Q3: What is the coordinate of the lower-right corner pixel of the figure?
Too Tricky - Easier Drawing
Above is too tricky: Strategy put in real numbers and a tiny width, say width is 5. Then we can count the pixels over to the corner to see the math. Here is the drawing for that. What are coordinates with width=5. Then try to figure out the general formula. This is a funny juxtaposition - look at with a dinky number like 5, then work out the general formula that works for infinite cases.

Corner Coordinates In General

draw_oval() - draw_line() calls
Here are the lines which draw the 2 red lines in, just using the corner coordinates worked out above.
def draw_oval(canvas, left, top, width, height):
    ...
    # Draw red lines
    # upper-left to lower-right
    canvas.draw_line(left, top,
                     left + width - 1, top + height - 1,
                     color='red')

    # lower-left to upper-right
    canvas.draw_line(left, top + height - 1, left + width - 1, top, color='red')
Note: the first draw_line() shows one PEP8 style approved way to call a function with a lot of parameters, the second and later lines are indented to match the first. Just writing it all on one line is fine too, a shown with the second call.
Run From Command Line -oval 500 300
The main() in this case with args like -oval 500 300 calls draw_oval() twice, once upper left and once lower right. This tests that the left,top are handled correctly. Open the "terminal" at the lower left of PyCharm. The "$" below is the prompt, the rest you type (on Windows its "python" or "py" instead of "python3".) Close the drawing window when done, this exits the draw program.
$ python3 draw1.py -oval 300 200
Use The Up Arrow
In the terminal, hit the up arrow. Edit the old command and run it again easily. This is a very productive and fast way to run and vary your program.
Accessibility Screen Zoom In
Example 2 - draw_lines1()
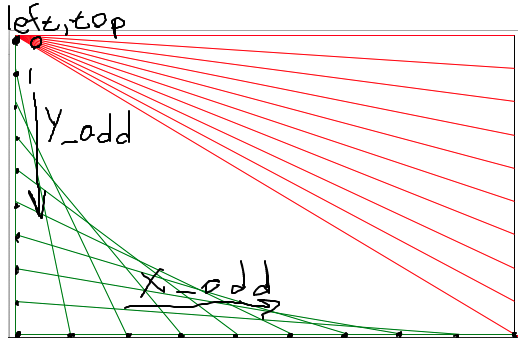
y_add Framework
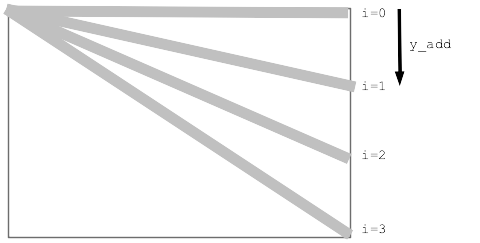
for/i/range Proportionately
Proportionate "fraction" Strategy
y_add Table
Figure fraction * max for y_add
Say n=4

i   fraction
0   0/3    y_add = 0.0  * (height - 1)
1   1/3    y_add = 0.33 * (height - 1)
2   2/3    y_add = 0.66 * (height - 1)
3   3/3    y_add = 1.0  * (height - 1)


Max y_add = (height - 1)
y_add = fraction * (height - 1)
fraction = i/3 aka i/(n-1)
Proportionate y_add Formula
for i in range(n):
    y_add = (i / (n - 1)) * (height - 1)
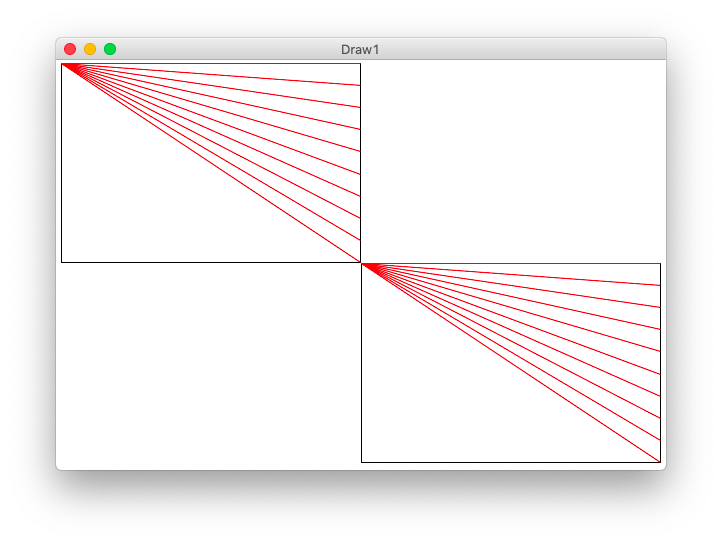
draw_lines1() Solution
Here is the formula at work to draw the red lines.
def draw_lines1(canvas, left, top, width, height, n):
    """
    Draw the lines1 figure within left,top .. width,height
    (this code is complete)
    """
    canvas.draw_rect(left, top, width, height)
    # Figure y_add for each i in the loop
    for i in range(n):
        y_add = (i / (n - 1)) * (height - 1)  # formula: fraction * max
        canvas.draw_line(left, top, left + width - 1, top + y_add, color='red')
draw_lines() Command Line -lines1 300 200 12
Run from command line
$ python3 draw1.py -lines1 300 200 12
Optional - Mod Color
What if we wanted to draw the lines alternating red, green, red, green...
A common way to do this is use modulus - look at the value of i % 2 in the loop. It will be either 0 or 1 alternating. (Modulus result is always 0..n-1). If it's 0 draw red, otherwise draw green.
draw_lines1() with alternating color:
    for i in range(n):
        y_add = (i / (n - 1)) * (height - 1)  # formula: fraction * max
        if i % 2 == 0:
            canvas.draw_line(left, top, left + width - 1, top + y_add, color='red')
        else:
            canvas.draw_line(left, top, left + width - 1, top + y_add, color='green')
Example 3 - draw_lines2()
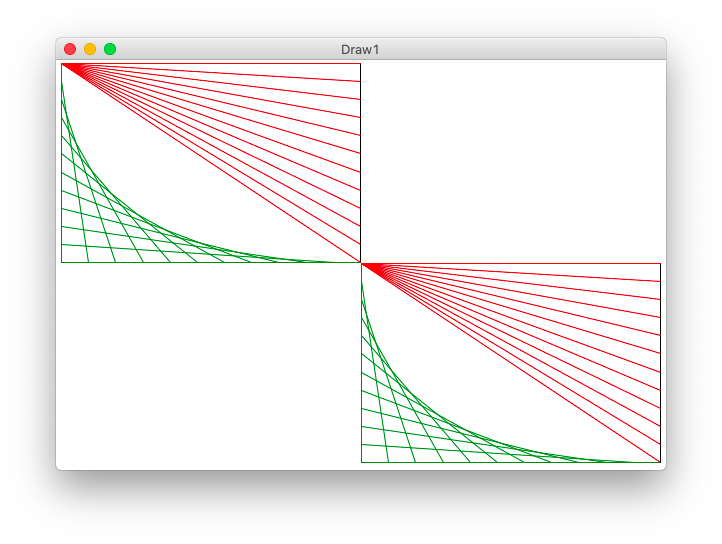
Strategy for lines2
One Line of Code for lines2
Look at the drawing to work out the x1,y1 x2,y2 to draw the green line. Demo-note: try to have the drawing visible while working out the code for this.
    # loop to draw green "lines2" lines
    for i in range(n):
        y_add = (i / (n - 1)) * (height - 1)
        x_add = (i / (n - 1)) * (width - 1)
        pass
        # Your code here - draw each green line
Run from the command line:
$ python3 draw1.py -lines2 300 200 12
draw_lines2() Solution Line
        ...
        # Your code here - draw each green line
        canvas.draw_line(left, top + y_add,
                         left + x_add, top + height - 1,
                         color='green')
Example 4 - draw_grid1()
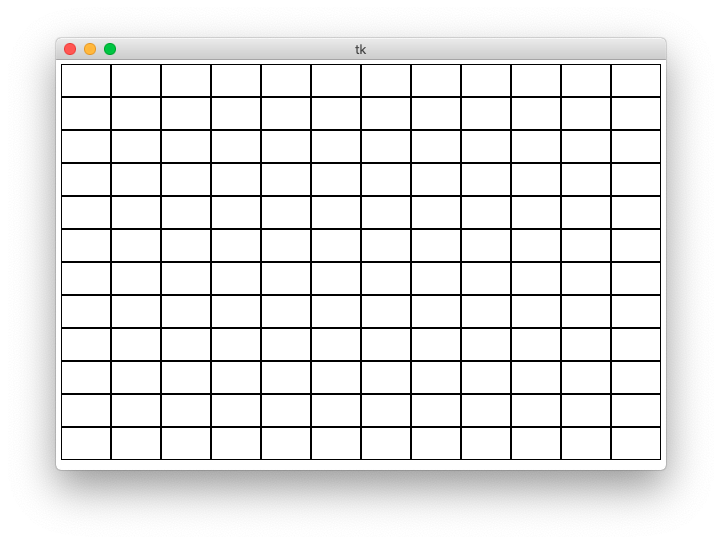
How Wide Is Each Rectangle?
>>> 500 / 11
45.45454545454545    # float division with fraction
>>> 500 // 11        # int division - what we want here
45
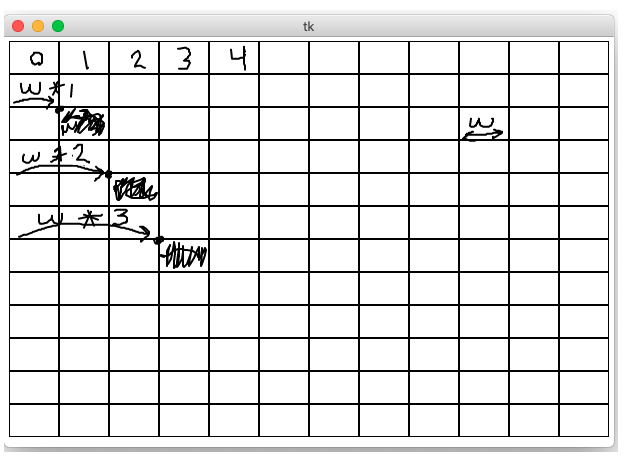
For each row/col number, what is its left,top coord?
grid1 Code
def draw_grid1(width, height, n):
    """
    Creates a canvas.
    Draws a grid1 of n-by-n black rectangles
    (this code is complete)
    """
    canvas = DrawCanvas(width, height, title='Draw1')

    # Figure sizes for all sub rects
    sub_width = width // n
    sub_height = height // n

    # Loop over row/col
    for row in range(n):
        for col in range(n):
            # Figure upper left of this sub rect
            left = col * sub_width
            top = row * sub_height
            canvas.draw_rect(left, top, sub_width, sub_height)
Run from command line:
$ python3 draw1.py -grid1 600 400 12
Try Grid Of ???
Change the code to fill a rect inside the grid1 loop, or draw a filled oval of some color. Whatever function call we put inside the loop, we get n * n copies of whatever that function draws.
            ...
            left = col * sub_width
            top = row * sub_height
            canvas.fill_oval(left, top, sub_width, sub_height, color='yellow')
Revisit draw_lines2()
Here is the draw_lines2() def first line:
def draw_lines2(canvas, left, top, width, height, n):
    """
    Draw the lines2 figure within left,top .. width,height
    The code for lines1 is already here
    """
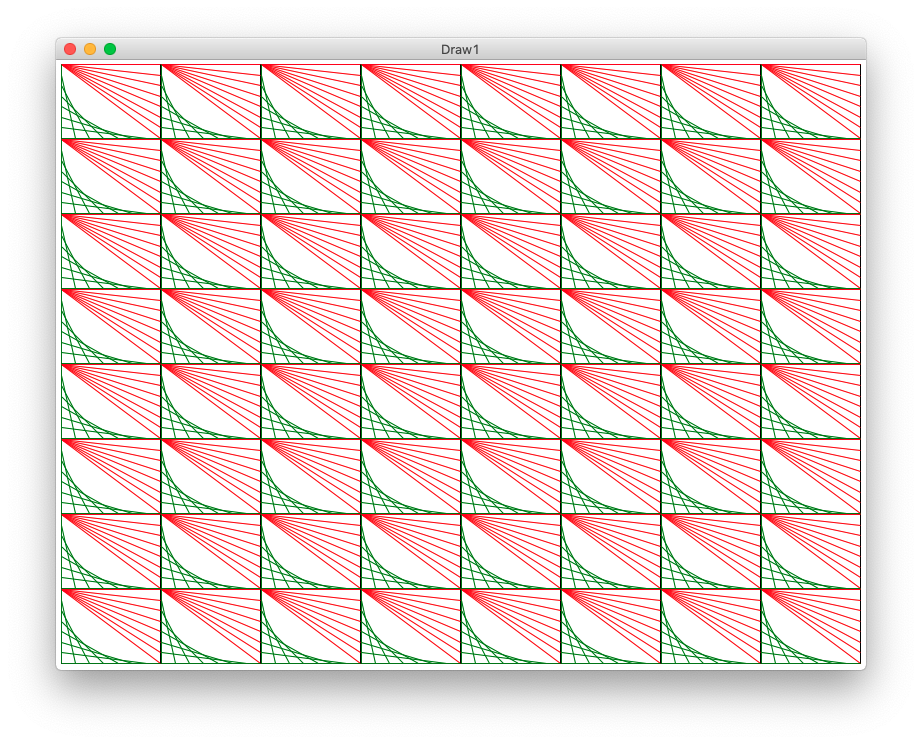
Example 5 - draw_grid2()
draw_grid2() Solution Code
def draw_grid2(width, height, n):
    """
    Creates a canvas.
    Add code to draw the lines2 figure in each grid sub rect.
    """
    canvas = DrawCanvas(width, height, title='Draw1')

    sub_width = width // n
    sub_height = height // n

    for row in range(n):
        for col in range(n):
            # Your code here - draw a lines2 figure in each grid rect
            pass
            left = col * sub_width
            top = row * sub_height
            # Key line: call function to do it,
            # passing in left,top,width,height,n we want
            draw_lines2(canvas, left, top, sub_width, sub_height, n)
Looks neat - loops + function-call = power!