![]()
In table 2 we provide the average playout rate determined in the analysis and in simulation experiments.

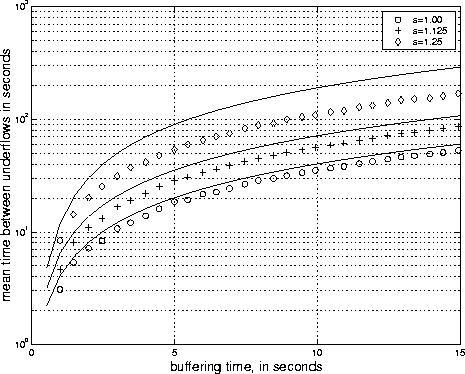
Figure 5: MTBBU for a long program. In this plot, ![]() ms. and
ms. and ![]() . Thus
. Thus ![]() . We see good agreement between the simulation results plotted as points,
and the analytical results which are plotted as lines.
. We see good agreement between the simulation results plotted as points,
and the analytical results which are plotted as lines.

Table 2: Scenario 2: The mean factor by which frames were slowed
down for during the program for a given slowdown factor.
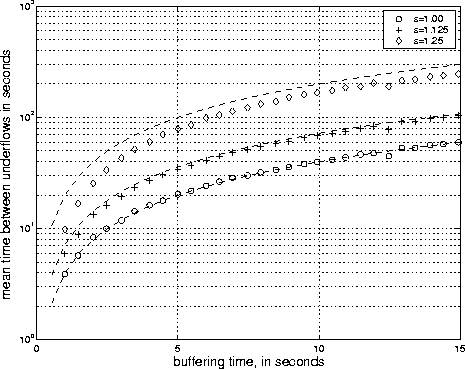
To further display that our analysis holds only when ![]() is sizeable, we include figure 6. In
this figure we have the same average packet arrival rate,
is sizeable, we include figure 6. In
this figure we have the same average packet arrival rate, ![]() , as in figure 5. Now, however,
, as in figure 5. Now, however, ![]() ms.,
ms., ![]() ms. and
ms. and ![]() = 0.
= 0.

Figure 6: MTBBU for a given target buffer level. Here ![]() , but
, but ![]() ,
, ![]() ms., and
ms., and ![]() ms. We see that because
ms. We see that because ![]() the analysis underestimates the probability of underflow.
the analysis underestimates the probability of underflow.
Finally, we should note that a much simpler analysis produces accurate results, especially for the non adaptive case. By comparing the average rate of packet arrival do the rate at which packets depart, one can arrive at the following expression for the mean duration between buffer underflows:
where ![]() =
= ![]() Figure 7 compares the experimental results
with this simple analysis.
Figure 7 compares the experimental results
with this simple analysis.

Figure 7: In this figure we show that when the average rate
of the channel is considerably lower than that of playout rate, the simple
approximation in equation 18 is accurate.
Here ![]() ms.
ms. ![]() = .5.
= .5. ![]() .
.