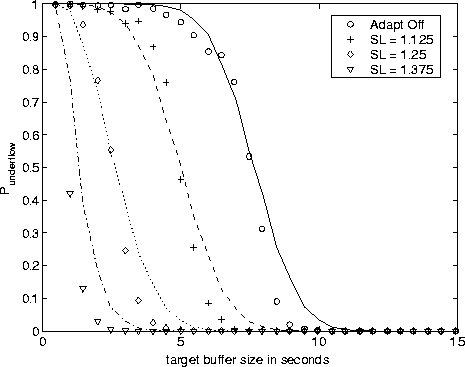
Figure 3: Scenario 1: Probability of underflow versus target
buffer length ![]() . The channel is characterized by
. The channel is characterized by ![]() =
= ![]() = 100 ms
= 100 ms ![]() = .5. Experimental data are plotted as points, analytical results as lines.
With the packet errors, the effective frame arrival rate
= .5. Experimental data are plotted as points, analytical results as lines.
With the packet errors, the effective frame arrival rate ![]() is 0.75.
is 0.75.
Table 4.1 shows the mean playout duration in the experiments and in the analysis. Included in table is the length of the playout if each frame was played at the adaptive rate (assuming that the the buffer falls below the target level for the entire simulation).
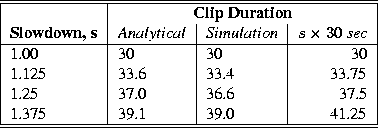
Table 1: Scenario 1: Mean playout duration of the 30 second
clip. Results from the analysis, simulations and for all frames played
at the slowed rate.
We include figure 4 to show that our
analysis depends on ![]() being reasonably large. In figure 4,
being reasonably large. In figure 4, ![]() ,
, ![]() , and
, and ![]() . Though
. Though ![]() is the same as in figure 3, the experimental
data changes significantly, while the analytical results do not.
is the same as in figure 3, the experimental
data changes significantly, while the analytical results do not.
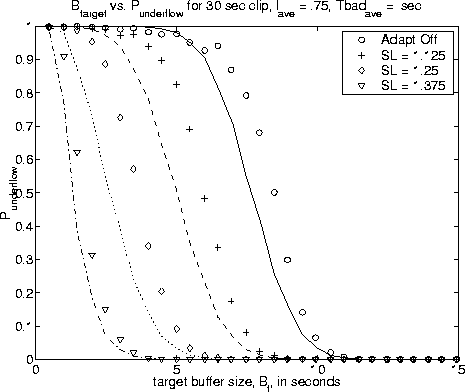
Figure 4: Scenario 1: The analysis is not accurate for low ![]() . Here,
. Here, ![]() . Although
. Although ![]() is the same as in previous case, because no retransmissions arrive the
assumption that we make about the packet errors acting as a reduction in
bandwidth does not hold. When the channel enters the bad state, the buffer
starts emptying at the playout rate. Thus we see a higher probability of
underflow than the analysis would predict.
is the same as in previous case, because no retransmissions arrive the
assumption that we make about the packet errors acting as a reduction in
bandwidth does not hold. When the channel enters the bad state, the buffer
starts emptying at the playout rate. Thus we see a higher probability of
underflow than the analysis would predict.