What Can We Learn About the Impact of Proposition 227 from SAT-9 Scores?
An Analysis of Results from 2000.
Jennifer Evelyn Orr, Yuko Goto Butler, Michele Bousquet, and Kenji Hakuta
Stanford University
August 15, 2000
![]() with a PostScript on Oceanside and Californians Together Report, updated August
27, 2000
with a PostScript on Oceanside and Californians Together Report, updated August
27, 2000
send comments to: hakuta@stanford.edu
Statewide scores for LEP student performance on the Stanford 9 (SAT-9) test for the year 2000 were released on August 15. The results are of particular interest to those who have followed the impact of Proposition 227, a ballot initiative spearheaded by Ron Unz and passed by California voters in 1998. Last year's SAT-9 results enabled a comparison of the results from 1998 and 1999, and were examined to identify the results of Proposition 227. Scrutiny of the year 2000 SAT-9 results for LEP students continues in this webpage. Ron Unz provides a comprehensive list of media coverage on the release of the 2000 scores at http://www.onenation.org/news.html.
Background from the 1999 Analysis
Increases in LEP scores during the 1998-1999 period was touted by proponents of 227 as validation of the English-only approach. Unz declared early victory through his website. Meanwhile, a quick analysis by Hakuta and his colleagues at Stanford revealed the following problems with the conclusion that Proposition 227 led to increases in SAT-9 scores:
Our analysis argued that the pattern of scores did not provide a basis for a resounding claim to victory for Proposition 227. Scores rose for all students, and in no clear pattern that could be attributable to Proposition 227. Click here for the previous paper.
Extension to the Data from 2000
Table 1 shows data for reading, math, and language scores for LEP students, and for all students. The table shows data from 1998, 1999 and 2000. Columns in red between the years show change in percentile rank, and the last column shows the change from 1998 to 2000. There are virtually identical patterns of increases for both LEP and for all students, with the increases being most prominent in the earlier grades, especially Grades 2 and 3.
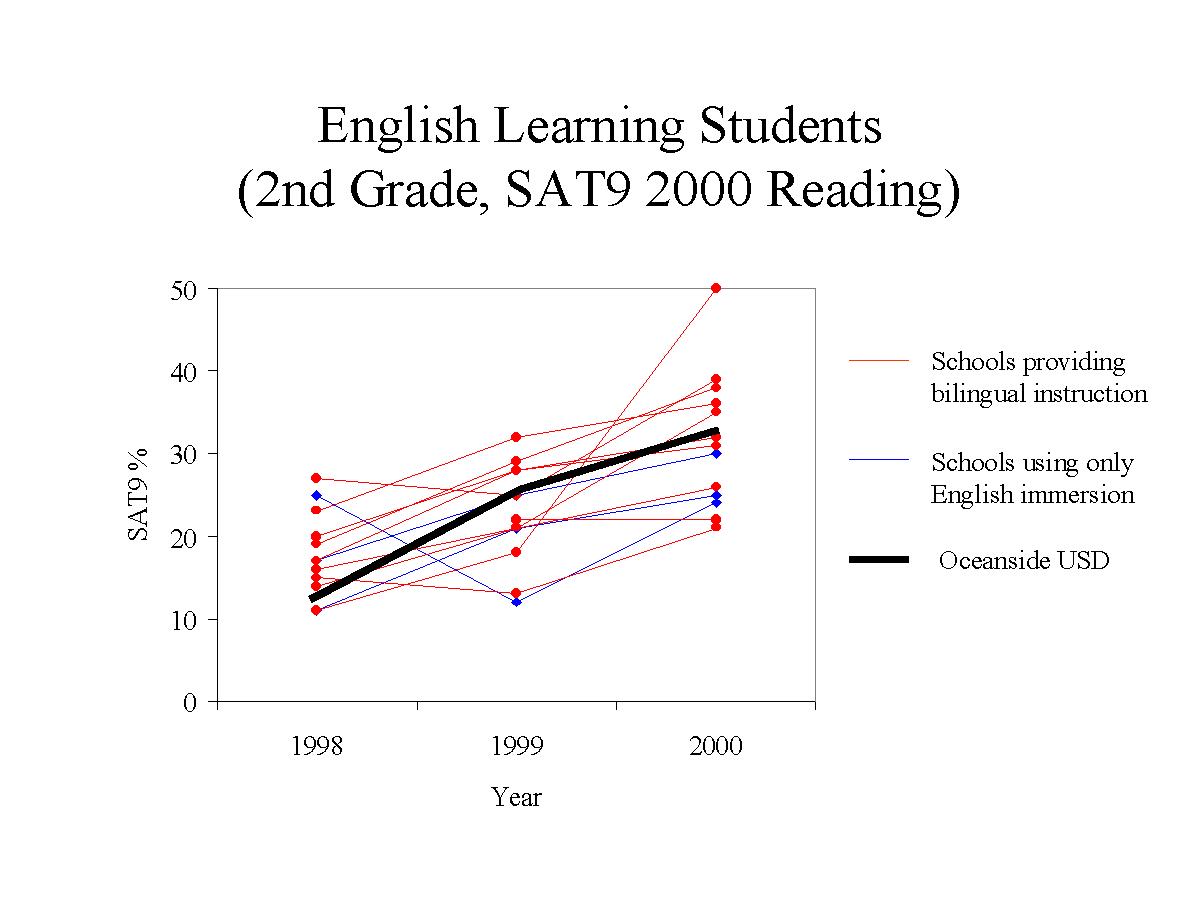
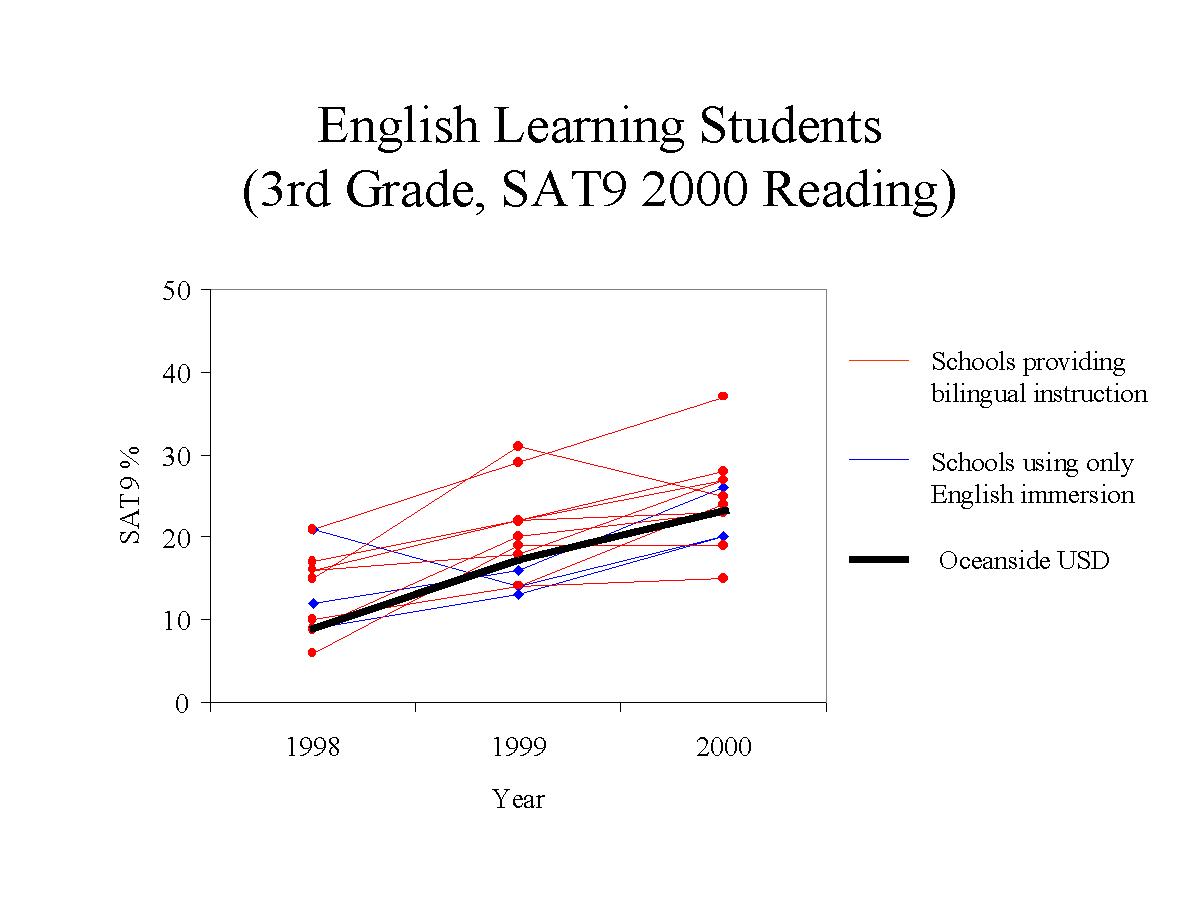
Additional follow-up was made of the same random sample of schools that was used for last year's analysis, in which we looked at performance of 3rd grade students who were low-achieving LEP and non-LEP students. In order to make this comparison, we selected schools that had overall low performance in reading, for both LEP and non-LEP students. Specifically, for non-LEP students, we identified schools in which there were fewer than 3% LEP students, but in which the average National Percentile Rank score was low (<27th percentile) in Reading for 1998. We then tracked the changes in these schools for 1999, and now into 2000. For the LEP students, we randomly sampled 26 schools that had high proportions of LEP students (>80%), and who had low reading scores in SAT-9 for 1998 (<10th percentile). We also traced the changes in these schools for 1999, and now into 2000. Tracking student performance in these schools is arguably the cleanest comparison of LEP and non-LEP students in low-reading schools allowable by these data.
The results are shown graphically in Figures 1-6. As the bold lines (indicating the median percentile rank) show, there are clear increases in reading, math and language across the three years for both LEP and non-LEP native English speakers in schools with low reading scores. Again, as in the statewide statistics, the increased performance on SAT-9 seems to be across the board. Statistically-minded readers will be interested in noting the clear regression effects that can be seen in the data from 1998 to 1999, since the schools were all selected for their low reading scores.
Finally, we revisited the school districts that we highlighted last year. Our analysis for 1998-1999 showed across-the-board increases across different districts that reportedly
Examination of these data show a continued trend in that direction, with overall increases, especially visible in Grades 2 and 3. It is noteworthy that the increases are visible just as much in math as it is in reading and language.
What is responsible for these patterns in increased SAT-9 scores for LEP students? Extreme caution is needed from giving them too much meaning for two main reasons:
Further, we do know that the SAT-9 is being taken more seriously across school districts, especially with its use in the API, and we know from the experience of testing policies in other states that the first several years of a testing program show increases as the system becomes familiar with the new test.
In addition to the inadequacy of the information from SAT-9 for LEP students, we really don't have very much information about what actual change came about as a result of Proposition 227. During the past few years, there has been an enormous focus on school reform in California. An increased focus on English language development, precipitated by various school reform initiatives including Proposition 227, might be one candidate explanation, both in English-only and in bilingual education programs (which, contrary to popular views, do devote substantial effort in teaching English as a second language). But there could be many others.
We certainly should be happy that the educational system and the public are paying more attention to the academic progress of immigrant students, but this should only be considered a warm-up act in accountability and school reform if we wish to seriously address their many needs.
![]() PostScript
on Oceanside and Californians Together Report (August 27, 2000)
PostScript
on Oceanside and Californians Together Report (August 27, 2000) ![]()
[Yuko Goto Butler and Michele Bousquet conducted the analyses provided below]
After we finalized this report, a report was released by Californians Together, an advocacy group for bilingual education. (Click here for pdf version of the report). That report highlighted the SAT-9 scores in 10 elementary schools that had large enrollments of LEP students, and with what it claims "offer substantial bilingual instruction with adequate materials and with qualified teachers for Spanish speaking English learners." The report further compared those results with "three schools that have been highlighted by proponents of Proposition 227 as good examples where school district and community preferences have limited instruction exclusively to structured English immersion." The report concludes that bilingual schools "can equal or exceed the performance in English of schools providing instruction only in English."
The Californians Together report does not provide data on percentile ranks that are consistent with the way in which we have chosen to report data in our analyses. We therefore went back to the schools named in their analyses -- 10 schools that are designated as exemplary bilingual, and three that have been included because they have been the focus of pro-English immersion advocacy (including one in Oceanside with a high proportion of LEP students) -- and we downloaded data from the SDE website on percentile ranks for the mean NCE for each school. In addition, because Oceanside has been the focus of such intense interest as a key success by Proposition 227 advocates, we downloaded data for each school in Oceanside, to begin examining school-level performance of LEP students on SAT-9.
On this postscript, we provide the following three observations:
These observations simply serve to reinforce our initial observations about the limitations of the SAT-9 data for drawing conclusions about the effects of Proposition 227.
