How pixel and sensor parameters influence sensor SNR.
The basic SNR formula is: SNR = 10*log10(signalPower/noisePower)
Power is measured in units of squared electrons (variance) for noise and thus squared electrons for the signal, too. Because of the squaring, we multiply the log10 by 10, not 20. The units of SNR calculated this way are decibels (db). It is equivalent to calculate
SNR = 20 log10(signalMean/noiseSD)
We measure signal and noise power and variance in units of electrons (rather than volts) because we know that the shot noise is Poisson distributed when specified in units of electrons (but not in volts).
The signalPower is calculated from the volts by converting volts to electrons and squaring the result: signalPower = (volts/convGain).^2;
For a sensor, the noisePower is the sum of the variance of a diverse set of noise variables: shot noise, read noise, dsnu noise, and prnu noise.
noisePower = shotSD.^2 + readSD.^2 + dsnuSD.^2 + prnuSD.^2;
The noise values are all calculated in electrons, not volts, because the shot noise is Poisson in units (but not volts).
Some noise quantities are signal-dependent (shot noise, prnu). Other noise quantities are signal-indpendent (readSD, dsnuSD).
For signal-independent noise quantities, the SNR limit for that type of noise increases as the signal increases. For signal-dependent quantities the SNR is constant (prnu) or decreasing slowly, say as a square root, (shot noise) as the signal increases.
Copyright ImagEval Consultants, LLC, 2010.
Contents
ieInit
Create a default sensor and pixel
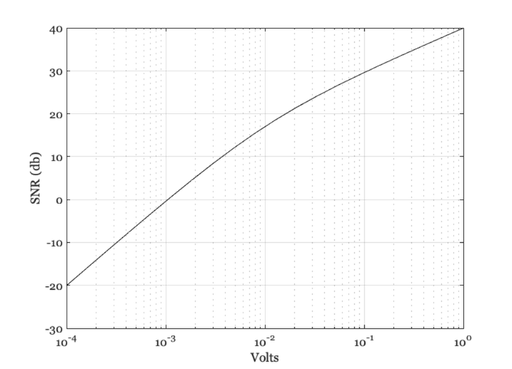
sensor = sensorCreate;
pixel  = sensorGet(sensor,'pixel');

% Set the voltage range we assess.
% We measure SNR over a 4 log unit range
vSwing = pixelGet(pixel,'voltageSwing');
volts = logspace(log10(vSwing)-4,log10(vSwing),20);

% Compute the SNR
SNR = sensorSNR(sensor,volts);

% Plot the relation between mean voltage level and SNR
ieNewGraphWin;
semilogx(volts,SNR,'k-');
grid on; ylabel('SNR (db)'); xlabel('Volts')
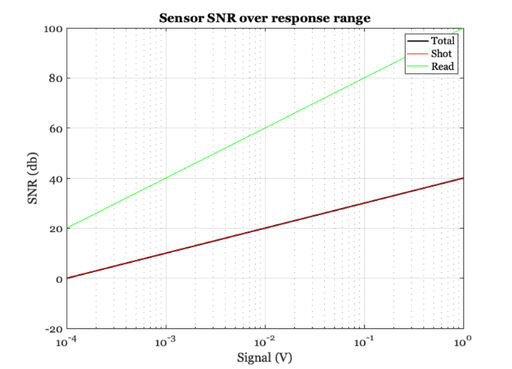
Another way to do the calculation and plot
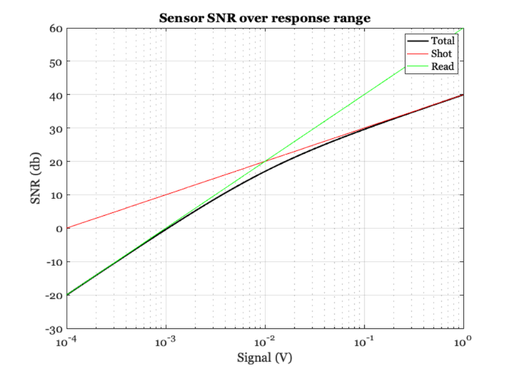
ieNewGraphWin;
uData = plotSensorSNR(sensor);
uData

% Notice that for this plot we also show the SNR limit associated with
% specific sources of noise.  In the graph above the Shot and Read noise
% are visible, but not the DSNU or PRNU.  That is because these values are
% 0 in the default.  We will do examples later in which these are non-zero.
uData =

  struct with fields:

    volts: [1.0000e-04 1.2068e-04 1.4563e-04 1.7575e-04 … ] (1×50 double)
      snr: [-20.0432 -18.4194 -16.7975 -15.1777 -13.5605 … ] (1×50 double)

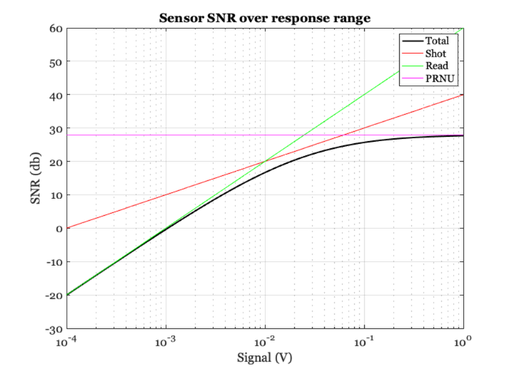
Set the pixel read noise higher and plot again
readN   = pixelGet(pixel,'readNoise');
pixel   = pixelSet(pixel,'readNoiseVolts',10*readN);
sensor2 = sensorSet(sensor,'pixel',pixel);

% In this case, the read noise is the limiter.
vcNewGraphWin;
plotSensorSNR(sensor2);

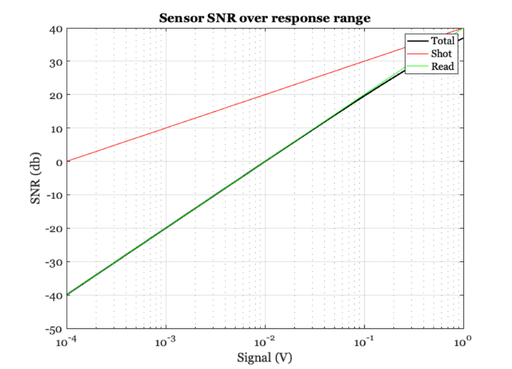
Now we reduce the read noise a lot
pixel   = pixelSet(pixel,'readNoiseVolts',0.01*readN);
sensor3 = sensorSet(sensor,'pixel',pixel);

% In this case, the shot noise is the limiter.
vcNewGraphWin; plotSensorSNR(sensor3); drawnow;

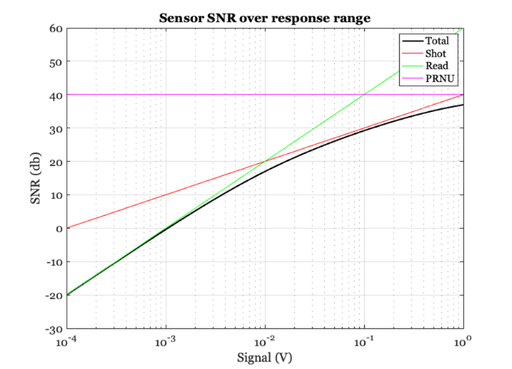
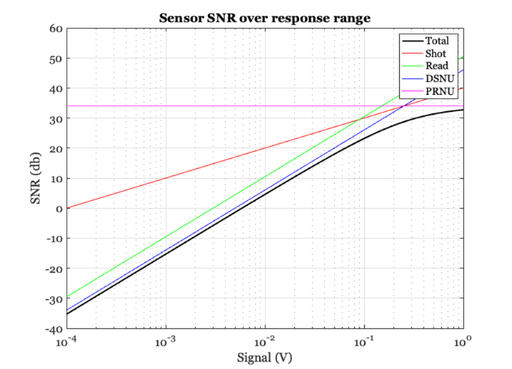
The effect of PRNU
% Photoresponse nonuniformity is a percentage that describes how much the
% slope of the photoresponse function varies across pixels.  The value is
% always set as a percentage.
sensor4 = sensorSet(sensor,'gainSD',1.0);

% When we make the SNR plot, a third line appears to show the SNR limit
% from this amount of PRNU.  Notice that at this level, it only influences
% the SNR at the highest voltage range
vcNewGraphWin; plotSensorSNR(sensor4); drawnow;

% At this level, the PRNU matters at lower voltage levels and bounds the
% highest SNR the sensor can achieve.  At lower levels, the read noise is
% still the dominant factor.  There is a voltage range at which all of the
% factors matter.
sensor4 = sensorSet(sensor,'gainSD',4.0);
vcNewGraphWin; plotSensorSNR(sensor4); drawnow;


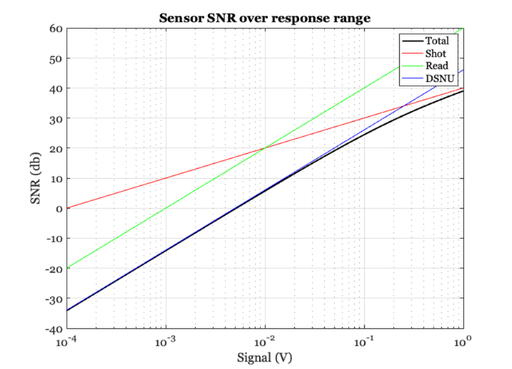
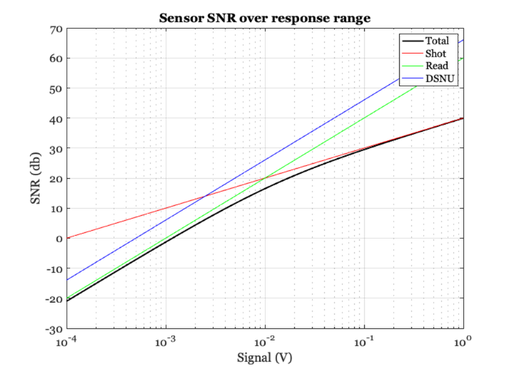
The effect of DSNU
% The dark signal nonuniformity is the standard deviation in the black
% level of different pixels.  Up to this point, the difference was set to
% zero.  Here, we set it to be a percentage of the total voltage swing
sensor5 = sensorSet(sensor,'offsetSD',vSwing*0.0005);

% At this small level (5 parts in 10,000) the DSNU is not important.
vcNewGraphWin; plotSensorSNR(sensor5); drawnow;

% If we increase it to half a percent, it  matters.  In this case it is the
% dominant source of noise until the high voltage levels.
sensor5 = sensorSet(sensor,'offsetSD',vSwing*0.005);
vcNewGraphWin; plotSensorSNR(sensor5); drawnow;


Combined noise
% Here, we see the interaction of all of the noises by increasing the read
% noise a bit, setting DSNU and PRNU levels appropriately, so that there is
% a range of the voltage response where all the factors influence the SNR.
pixel   = pixelSet(pixel,'readNoiseVolts',3*readN);

sensor5 = sensorSet(sensor5,'pixel',pixel);
sensor5 = sensorSet(sensor5,'gainSD',2.0);
sensor5 = sensorSet(sensor5,'offsetSD',vSwing*0.005);
vcNewGraphWin; plotSensorSNR(sensor5);drawnow;

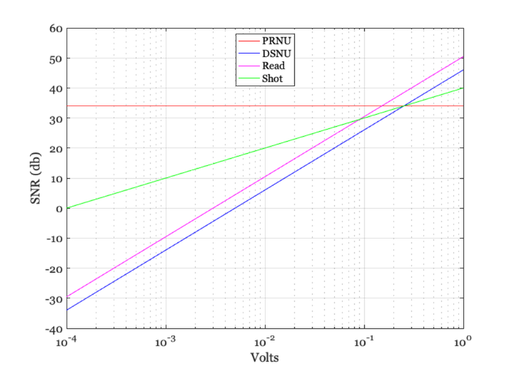
Use the more complete form of sensorSNR function to get SNR components
% The additional SNR returns are the curves plotted in plotSensorSNR
[SNR, volts, SNRshot, SNRread, SNRdsnu, SNRprnu] = sensorSNR(sensor5,volts);

% Plot the relation between mean voltage level and SNR limits from the PRNU
% and DSNU.
vcNewGraphWin;
semilogx(volts,SNRprnu,'r-',...
    volts,SNRdsnu,'b-', ...
    volts,SNRread,'m-', ...
    volts,SNRshot,'g-');
grid on; ylabel('SNR (db)'); xlabel('Volts')
legend({'PRNU','DSNU','Read','Shot'},'Location','north')