Extracting region of interest (ROI) scene data
We illustrate ROIs and plotting for photons, energy, illuminant and reflectance.
Most of these cases are managed by scenePlot, though it is useful to know how to extract the data directly for computing.
Copyright Imageval Consulting, LLC 2005
Contents
ieInit
Create a scene
scene = sceneCreate;
w = sceneGet(scene,'wave');
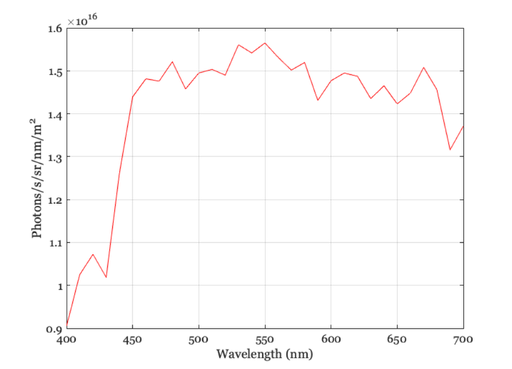
Photons
sz = sceneGet(scene,'size');
roi = round( [sz(1)/2, sz(2), 10, 10]);
p = sceneGet(scene,'roi photons',roi);
meanP = sceneGet(scene, 'roi mean photons', roi);

vcNewGraphWin;
plot(w,p); hold on;
plot(w, meanP, 'r-', 'LineWidth', 2.0);
xlabel('Wavelength (nm)'); ylabel('Photons/s/sr/nm/m^2'); grid on

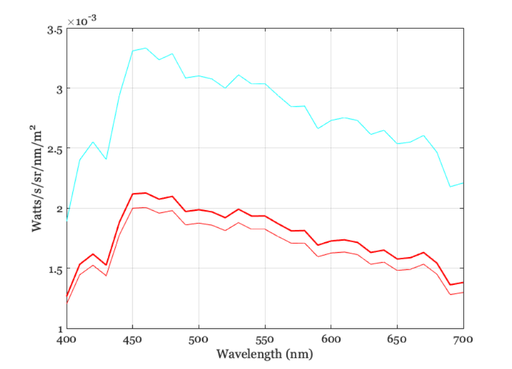
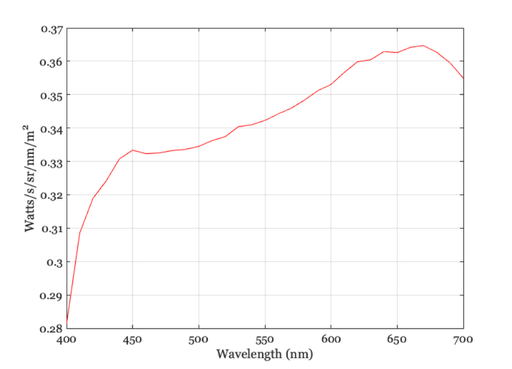
Energy
e = sceneGet(scene,'roi energy',roi);
meanE = sceneGet(scene, 'roi mean energy', roi);

vcNewGraphWin;
plot(w,e); hold on;
plot(w, meanE, 'r-', 'LineWidth', 2.0)
xlabel('Wavelength (nm)'); ylabel('Watts/s/sr/nm/m^2'); grid on
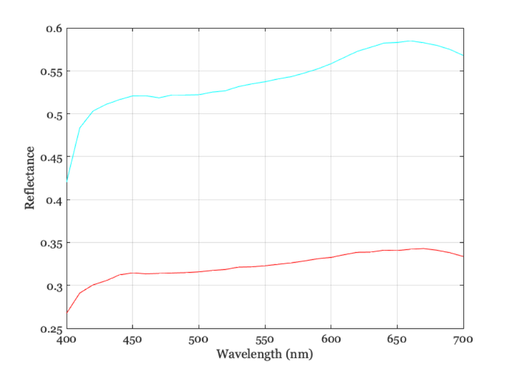
Reflectance as XW matrix, but derived here
photons       = sceneGet(scene,'roi photons', roi);
illuminantSPD = sceneGet(scene,'roi illuminant photons',roi);
meanIlluminantSPD = sceneGet(scene,'roi mean illuminant photons',roi);
reflectance   = photons ./ illuminantSPD;

vcNewGraphWin;
plot(w,reflectance);
xlabel('Wavelength (nm)'); ylabel('Reflectance'); grid on
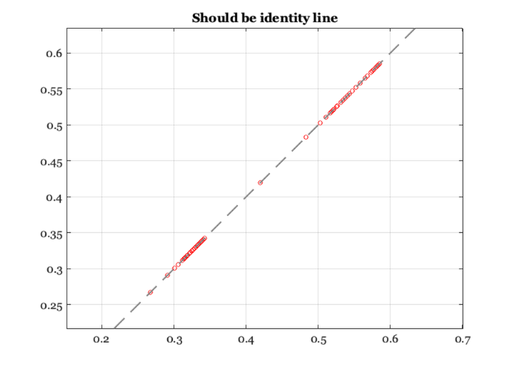
As above, but by the get directly
r = sceneGet(scene,'roi reflectance', roi);

% Now compare
vcNewGraphWin;
plot(r(:),reflectance(:),'o');
title('Should be identity line'); axis equal; grid on; identityLine;
Region of interest for mean reflectance
r = sceneGet(scene,'roi mean reflectance',roi);

vcNewGraphWin;
plot(w,r);
xlabel('Wavelength (nm)'); ylabel('Watts/s/sr/nm/m^2'); grid on
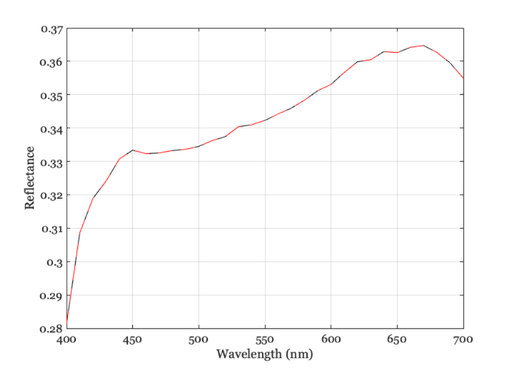
Compute the mean reflectance here and compare
r2 = mean(r,1);
vcNewGraphWin;
plot(w,r,'k-',w,r2,'r--');
xlabel('Wavelength (nm)'); ylabel('Reflectance'); grid on
Mean illuminant in an ROI
illuminantSPD = sceneGet(scene,'roi illuminant photons',roi);
meanIlluminantSPD = sceneGet(scene,'roi mean illuminant photons',roi);

vcNewGraphWin;
plot(w,illuminantSPD);
xlabel('Wavelength (nm)'); ylabel('Photons/s/sr/nm/m^2'); grid on