Creating your own reflectance chart
Create a set of surface reflectance samples to use in establishing sensor correction values.
See also: s_sceneReflectanceCharts, s_sceneReflectanceChartBasisFunctions
Copyright ImagEval Consultants, LLC, 2013.
Contents
ieInit
Randomly select reflectances
% The files containing the reflectances are in ISET format, readable by
% s = ieReadSpectra(sFiles{1});
sFiles = cell(1,4);
sFiles{1} = which('MunsellSamples_Vhrel.mat');
sFiles{2} = which('Food_Vhrel.mat');
sFiles{3} = which('DupontPaintChip_Vhrel.mat');
sFiles{4} = which('HyspexSkinReflectance.mat');

%{
sFiles{1} = fullfile(isetRootPath,'data','surfaces','reflectances','MunsellSamples_Vhrel.mat');
sFiles{2} = fullfile(isetRootPath,'data','surfaces','reflectances','Food_Vhrel.mat');
sFiles{3} = fullfile(isetRootPath,'data','surfaces','reflectances','DupontPaintChip_Vhrel.mat');
sFiles{4} = fullfile(isetRootPath,'data','surfaces','reflectances','HyspexSkinReflectance.mat');
%}
% The number of samples from each of the data sets, respectively
sSamples = [24,24,24,24];

% How many row/col spatial samples in each patch (they are square)
wave     =  400:5:700;
sampling = 'no replacement';
[reflectance, sSamples] = ieReflectanceSamples(sFiles,sSamples,wave,sampling);
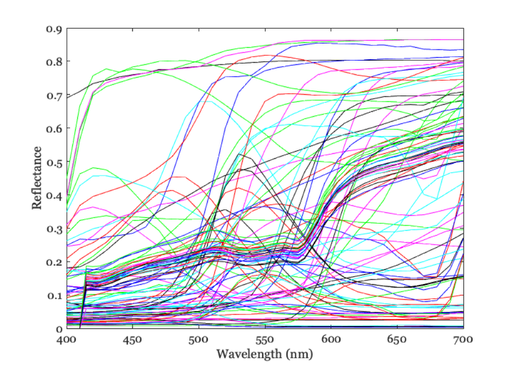
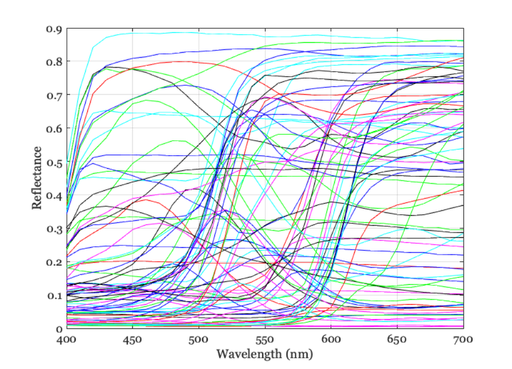
Plot the samples
vcNewGraphWin;
plot(wave,reflectance)
xlabel('Wavelength (nm)');
ylabel('Reflectance')
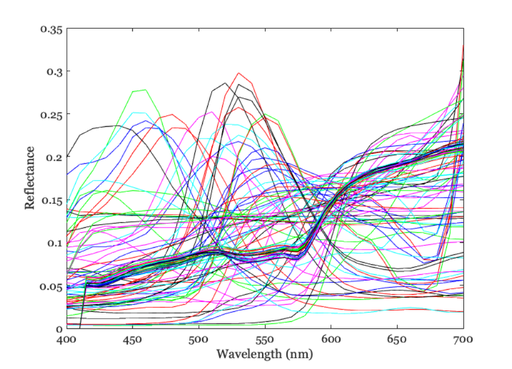
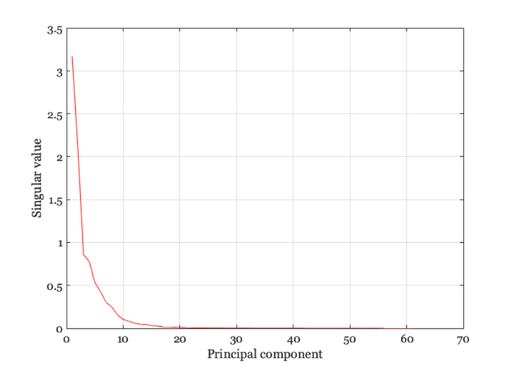
Statistics
% Scale the reflectance samples to equal vector length
s = reflectance'*reflectance;
s = diag(s);
r = reflectance*diag(1./(s.^0.5));
vcNewGraphWin; plot(wave,r)
xlabel('Wavelength (nm)');
ylabel('Reflectance')

nSamples = size(reflectance,2);
mn = mean(r,2);
sValues = svd(r - repmat(mn,1,nSamples));
vcNewGraphWin; plot(sValues)
grid on
xlabel('Principal component')
ylabel('Singular value')
Control the surface reflectance samples more finely
sFiles = cell(1,2);
sFiles{1} = which('MunsellSamples_Vhrel.mat');
sFiles{2} = which('DupontPaintChip_Vhrel.mat');
%{
sFiles{1} = fullfile(isetRootPath,'data','surfaces','reflectances','MunsellSamples_Vhrel.mat');
sFiles{2} = fullfile(isetRootPath,'data','surfaces','reflectances','DupontPaintChip_Vhrel.mat');
%}
sSamples = [12,12]*5;
[reflectances, sList] = ieReflectanceSamples(sFiles,sSamples,wave);
vcNewGraphWin; plot(wave,reflectances);
xlabel('Wavelength (nm)');
ylabel('Reflectance')
grid on
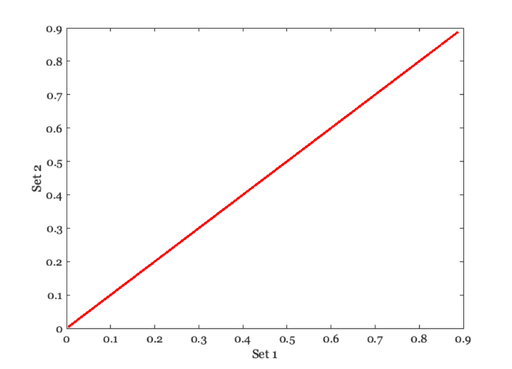
The first call specified
reflectances2 = ieReflectanceSamples(sFiles,sList,wave);
vcNewGraphWin; plot(reflectances(:),reflectances2(:),'.')
xlabel('Set 1')
ylabel('Set 2')