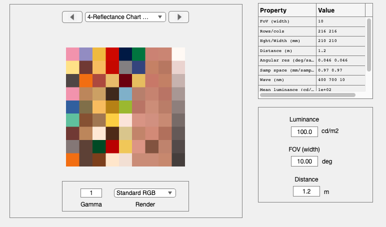
The Natural-100 reflectance chart
We designed a color chart containing 100 natural surfaces reflectances, including a neutral (achromatic) series. Germain et al., IS&T/SPIE, 2015
The Natural-100 chart contains many more surfaces than the classic Macbeth Color Checker. While the MCC is useful for certain extreme color reproduction tests, the N-100 chart is useful for testing more practical color algorithms including people.
We show both how to create several types of reflectance charts using the reflectance data included in ISET. We also show how to store the parameters so you can recreate the same chart at a later time.
See also: sceneCreate, sceneReflectanceChart, sceneAdjustIlluminant, s_sceneReflectanceChartBasisFunctions
Copyright ImagEval Consultants, LLC, 2010.
Contents
ieInit
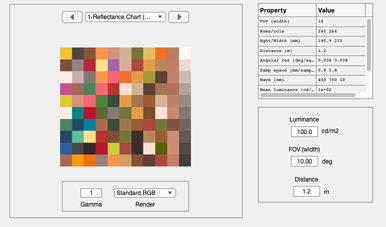
Default usage with sceneCreate
scene = sceneCreate('reflectance chart');
ieAddObject(scene);
sceneWindow;
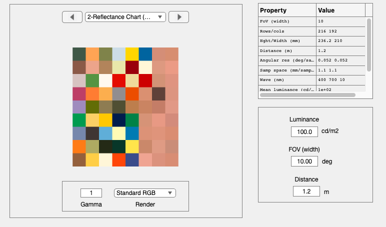
Create your own chart
% The files containing the reflectances are in ISET format, readable by
% s = ieReadSpectra(sFiles{1});
sFiles = cell(1,4);
sFiles{1} = which('MunsellSamples_Vhrel.mat');
sFiles{2} = which('Food_Vhrel.mat');
sFiles{3} = which('DupontPaintChip_Vhrel.mat');
sFiles{4} = which('HyspexSkinReflectance.mat');

%{
sFiles{1} = fullfile(isetRootPath,'data','surfaces','reflectances','MunsellSamples_Vhrel.mat');
sFiles{2} = fullfile(isetRootPath,'data','surfaces','reflectances','Food_Vhrel.mat');
sFiles{3} = fullfile(isetRootPath,'data','surfaces','reflectances','DupontPaintChip_Vhrel.mat');
sFiles{4} = fullfile(isetRootPath,'data','surfaces','reflectances','HyspexSkinReflectance.mat');
%}

% The number of samples from each of the data sets, respectively
sSamples = [12,12,24,24];    %

% How many row/col spatial samples in each patch (they are square)
pSize    = 24;           % Patch size
wave     = [];           % Whatever is in the reflectance data file
grayFlag = 0;            % No gray strip
sampling = 'no replacement';

scene = sceneCreate('reflectance chart',pSize,sSamples,sFiles,wave,grayFlag,sampling);

% The chart parameters are attached to the scene object
sceneGet(scene,'chart parameters')

% Show it on the screen
ieAddObject(scene); sceneWindow;
ans =

  struct with fields:

      sFiles: {1×4 cell}
    sSamples: {1×4 cell}
    grayFlag: [0]
    sampling: 'no replacement'
       pSize: [24]
        wave: [31×1 single]
         XYZ: [9×8×3 single]
      rowcol: [9 8]
     rIdxMap: [216×192 double]
Change the illumination from the default illuminant (equal energy) to D65
wave = sceneGet(scene,'wave');  d65 = ieReadSpectra('D65',wave);
sceneD65 = sceneAdjustIlluminant(scene,d65);
sceneD65 = sceneSet(sceneD65,'name','Reflectance Chart D65');
ieAddObject(sceneD65); sceneWindow;
Add a gray strip column
grayStrip = 1;
sceneGray = sceneReflectanceChart(sFiles,sSamples,pSize,wave,grayStrip);
sceneGray = sceneSet(sceneGray,'name','Reflectance Chart EE Gray Strip');

ieAddObject(sceneGray); sceneWindow;
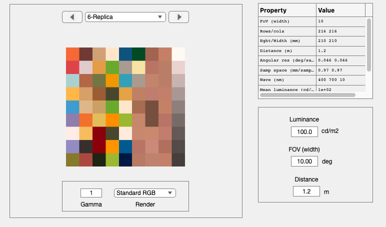
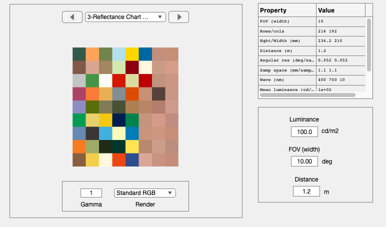
Store the parameters needed to make exactly the same chart
[sceneOriginal, storedSamples] = sceneReflectanceChart(sFiles,sSamples,pSize);
sceneOriginal = sceneSet(sceneOriginal,'name','Original');
ieAddObject(sceneOriginal); sceneWindow;

sceneReplica = sceneReflectanceChart(sFiles,storedSamples,pSize);
sceneReplica = sceneSet(sceneReplica,'name','Replica');
ieAddObject(sceneReplica); sceneWindow;