A scene color chart from specific reflectances.
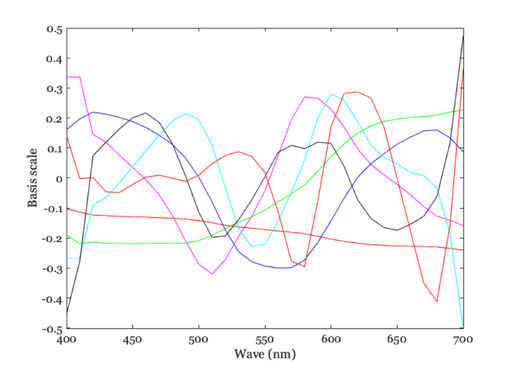
Color charts are useful for many types of testing. Here we build a chart from natural reflectance samples. We then find the spectral basis functions that describe 99.9% of the variance in the scene reflectances, and compress the scene data.
See also: sceneCreate, hcBasis
Copyright Imageval Consulting LLC, 2012
Contents
- Create the Natural-100 scene reflectance chart
- It is possible to choose your own reflectances
- Or write code like this to choose your own basis functions
- Approximate the reflectance chart with a linear model
- Show the basis functions
- Set a lower requirement for variance explained
- When bType is greater than 1, then hcBasis selects a number of basis functions
- Two ways to save the data
ieInit
Create the Natural-100 scene reflectance chart
scene = sceneCreate('reflectance chart');
It is possible to choose your own reflectances
%
Or write code like this to choose your own basis functions
s = ieReadSpectra(sFiles{1});
sFiles = cell(1,6);
sFiles{1} = fullfile(isetRootPath,'data','surfaces','reflectances','MunsellSamples_Vhrel.mat');
sFiles{2} = fullfile(isetRootPath,'data','surfaces','reflectances','Food_Vhrel.mat');
sFiles{3} = fullfile(isetRootPath,'data','surfaces','reflectances','DupontPaintChip_Vhrel.mat');
sFiles{4} = fullfile(isetRootPath,'data','surfaces','reflectances','HyspexSkinReflectance.mat');
sFiles{5} = fullfile(isetRootPath,'data','surfaces','reflectances','Nature_Vhrel.mat');
sFiles{6} = fullfile(isetRootPath,'data','surfaces','reflectances','Objects_Vhrel.mat');
sSamples = [12,12,24,5,24,12]; % Samples from each file
pSize = 24;    % Patch size
wave =[];      % Whatever is in the file
grayFlag = 0;  % No gray strip
sampling = 'no replacement';
scene = sceneReflectanceChart(sFiles,sSamples,pSize,wave,grayFlag,sampling);
ieAddObject(scene); sceneWindow;
Approximate the reflectance chart with a linear model
wave        = sceneGet(scene,'wave');
reflectance = sceneGet(scene,'reflectance');

% Do not remove the mean, and require explaining 0.999 of the variance
mType = 'canonical';  % The alternative is 'mean svd', which removes the mean first.
bType = 0.999;
[~, basisData,~,varExplained] = hcBasis(reflectance,bType,mType);
fprintf('Variance explained %.03f by %d bases\n',...
    varExplained,size(basisData,2));
Variance explained 0.999 by 7 bases
Show the basis functions
vcNewGraphWin;
plot(wave, basisData);
xlabel('Wave (nm)'); ylabel('Basis scale');

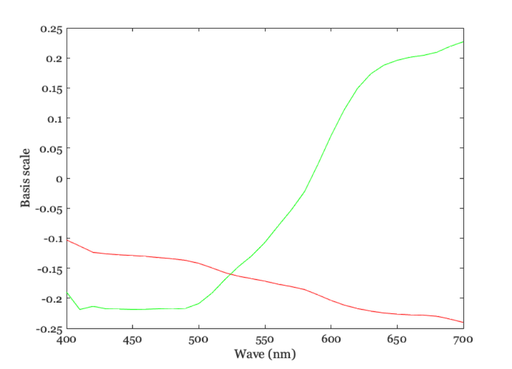
Set a lower requirement for variance explained
bType = 0.95;
[~, basisData,~,varExplained] = hcBasis( reflectance,bType,mType);
fprintf('Variance explained %.03f by %d bases\n',...
    varExplained,size(basisData,2));
vcNewGraphWin;
plot(wave, basisData);
xlabel('Wave (nm)'); ylabel('Basis scale');
Variance explained 0.971 by 2 bases

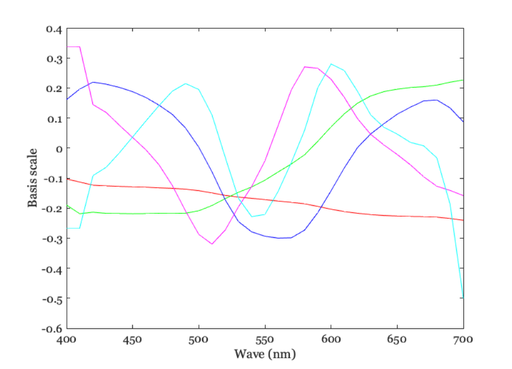
When bType is greater than 1, then hcBasis selects a number of basis functions
bType = 5;
[~, basisData,~,varExplained] = hcBasis( reflectance,bType,mType);
fprintf('Variance explained %.03f by %d bases\n',...
    varExplained,size(basisData,2));
tmp = size(basisData);

vcNewGraphWin;
plot(wave, basisData);
xlabel('Wave (nm)'); ylabel('Basis scale');
Variance explained 0.998 by 5 bases

Two ways to save the data
- sceneToFile
- ieSaveMultiSpectralImage