Creating scene illuminant structures
ISET scenes represent the scene spectral radiance and the scene illuminant. The spectral radiance is a hypercube of data, that is a spectral power distribution (vector) at each scene point.
The simplest illuminant is a single spectral power distribution. In this case the illuminant is constant (the same) at every point in the scene.
Alternatively, the scene illuminant can be a hypercube with the same size as the scene spectral radiance. In that case, we call spatial-spectral . The illuminant is potentially different at every point in the scene.
See also: illuminantCreate, s_sceneIlluminantMixtures, s_sceneIlluminantSpace
(c) Imageval Consulting, LLC 2012
Contents
- Create a blackbody illuminant structure 5000 deg Kelvin
- Create a blackbody illuminant at 3000 deg Kelvin
- D65, 200 cd/m^2
- Equal energy
- Equal photons
- CIE standard illuminant C
- Monochrome at 555 nm
- CIE D65 but sampled over a different wave range
- Interpolate and overlay the two different sampling resolutions
- Fluorescent illuminant
- Tungsten
ieInit
Create a blackbody illuminant structure 5000 deg Kelvin
illum = illuminantCreate('blackbody');
p     = illuminantGet(illum,'photons');
w     = illuminantGet(illum,'wave');

vcNewGraphWin;
plot(w,p); grid on
xlabel('Wavelength'); ylabel('Photons')
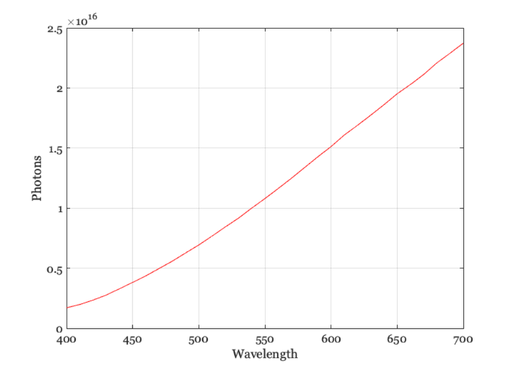
Create a blackbody illuminant at 3000 deg Kelvin
wave = 400:1:700;
illum = illuminantCreate('blackbody',wave,3000);
p     = illuminantGet(illum,'photons');
w     = illuminantGet(illum,'wave');

vcNewGraphWin;
plot(w,p); grid on
xlabel('Wavelength'); ylabel('Photons')
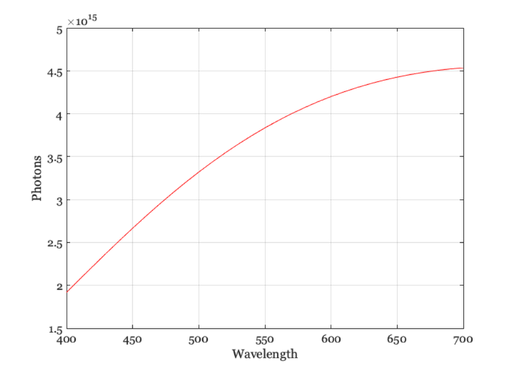
D65, 200 cd/m^2
luminance = 200;
wave = [];  % Defaults
illum = illuminantCreate('d65',wave,luminance);
p     = illuminantGet(illum,'photons');
w     = illuminantGet(illum,'wave');

ieNewGraphWin;
plot(w,p); grid on
xlabel('Wavelength'); ylabel('Photons')
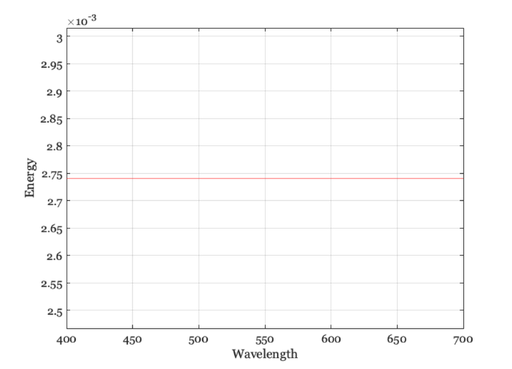
Equal energy
illum = illuminantCreate('equal energy',[],luminance);
e     = illuminantGet(illum,'energy');
w     = illuminantGet(illum,'wave');
mn    = mean(e(:));

vcNewGraphWin;
plot(w,e); grid on
xlabel('Wavelength'); ylabel('Energy')
set(gca,'ylim',[0.9*mn,1.1*mn]);
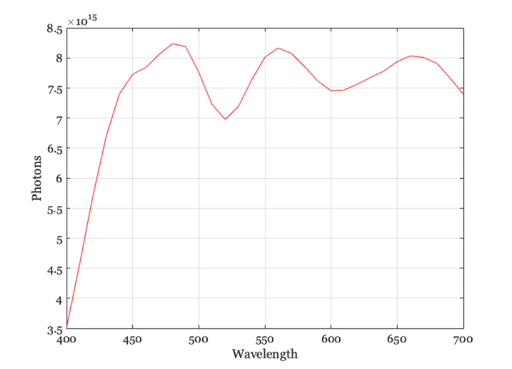
Equal photons
illum = illuminantCreate('equal photons',[],luminance);
p     = illuminantGet(illum,'photons');
e     = illuminantGet(illum,'energy');

w     = illuminantGet(illum,'wave');

vcNewGraphWin;
plot(w,p); grid on
xlabel('Wavelength'); ylabel('photons')
mn    = mean(p(:));
set(gca,'ylim',[0.9*mn,1.1*mn]);

vcNewGraphWin;
plot(w,e); grid on
xlabel('Wavelength'); ylabel('Energy')


CIE standard illuminant C
illum = illuminantCreate('illuminant C',[],luminance);
p     = illuminantGet(illum,'photons');
w     = illuminantGet(illum,'wave');

vcNewGraphWin;
plot(w,p); grid on
xlabel('Wavelength'); ylabel('Photons')
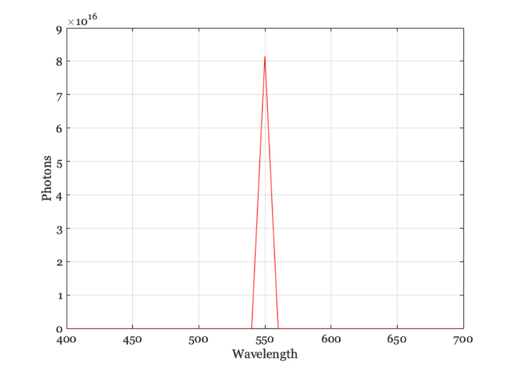
Monochrome at 555 nm
illum = illuminantCreate('555 nm',[],luminance);
p     = illuminantGet(illum,'photons');
w     = illuminantGet(illum,'wave');

vcNewGraphWin;
plot(w,p); grid on
xlabel('Wavelength'); ylabel('Photons')
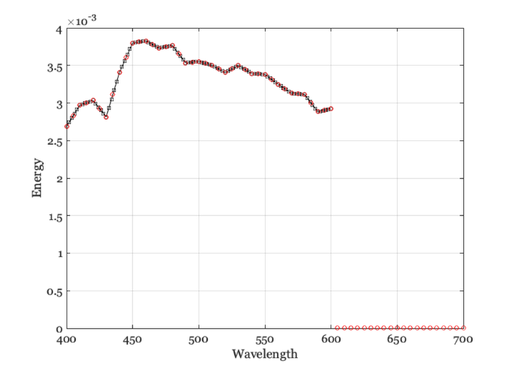
CIE D65 but sampled over a different wave range
illum = illuminantCreate('d65',400:2:600,200);
e     = illuminantGet(illum,'energy');
w     = illuminantGet(illum,'wave');

vcNewGraphWin([]);
plot(w,e,'ks-'); grid on
xlabel('Wavelength'); ylabel('Energy')
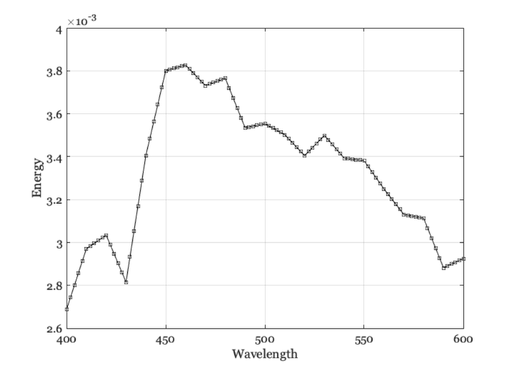
Interpolate and overlay the two different sampling resolutions
illum2 = illuminantSet(illum,'wave',400:5:700);
e     = illuminantGet(illum2,'energy');
w     = illuminantGet(illum2,'wave');

hold on;
plot(w,e,'ro'); grid on
xlabel('Wavelength'); ylabel('Energy')
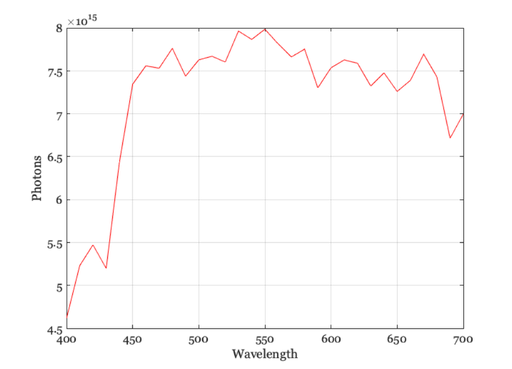
Fluorescent illuminant
illum = illuminantCreate('fluorescent',400:5:700,10);
p     = illuminantGet(illum,'photons');
w     = illuminantGet(illum,'wave');

vcNewGraphWin;
plot(w,p); grid on
xlabel('Wavelength'); ylabel('Photons')

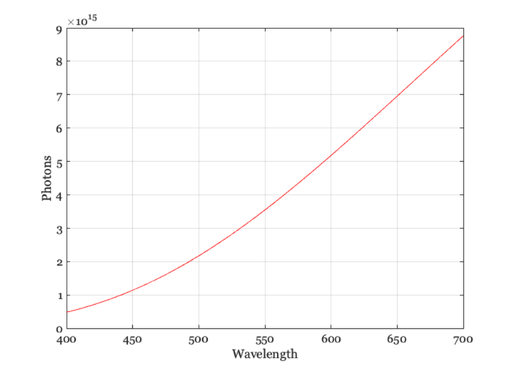
Tungsten
illum = illuminantCreate('tungsten',[],300);
p     = illuminantGet(illum,'photons');
w     = illuminantGet(illum,'wave');

vcNewGraphWin;
plot(w,p); grid on
xlabel('Wavelength'); ylabel('Photons')