Interacting with the scene Window
We can use the GUI interactively to select regions of interest (ROI) in the scene window. We can also extract data from an ROI by script and plot the scene energy, photons, or reflectance from the ROI.
In most cases the data we plot are stored in the plot window within a variable, 'userdata' that is attached to the figure.
See also: scenePlot, ieRoc2Locs, vcGetROIData
Copyright ImagEval Consultants, LLC, 2010
Contents
- Plot scene data
- The plot function returns the data and a handle to the window
- Scenes store information about the illuminant
- You can plot the spectral radiance energy from within an ROI
- Or plot the mean quanta (photons) at the same location
- Or plot the reflectance
- To read the photon data without plotting
- Or read the energy data
ieInit
Plot scene data
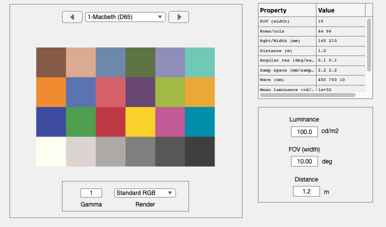
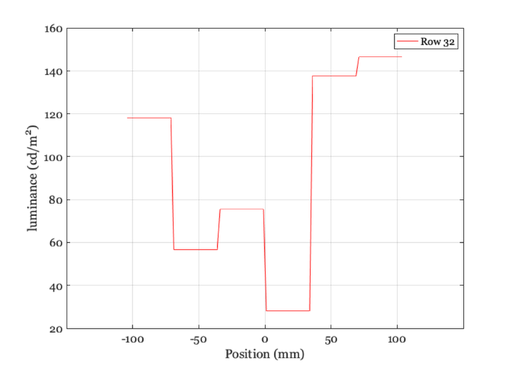
scene = sceneCreate('macbethd65');
ieAddObject(scene);
sceneWindow;

% Here are the luminance data from a line
rows = round(sceneGet(scene,'rows')/2);
The plot function returns the data and a handle to the window
[uData, h] = scenePlot(scene,'luminance hline',[1,rows]);

% This structure contains the data in the graph
uData

% This structure is also attached to the figure
get(h,'userdata')
uData =

  struct with fields:

        pos: [-103.8928 -101.7056 -99.5184 -97.3311 -95.1439 … ] (1×96 double)
       data: [96×1 double]
        row: 32
        cmd: 'plot(pos,lum)'
    roiLocs: [1 32]


ans =

  struct with fields:

        pos: [-103.8928 -101.7056 -99.5184 -97.3311 -95.1439 … ] (1×96 double)
       data: [96×1 double]
        row: 32
        cmd: 'plot(pos,lum)'
    roiLocs: [1 32]
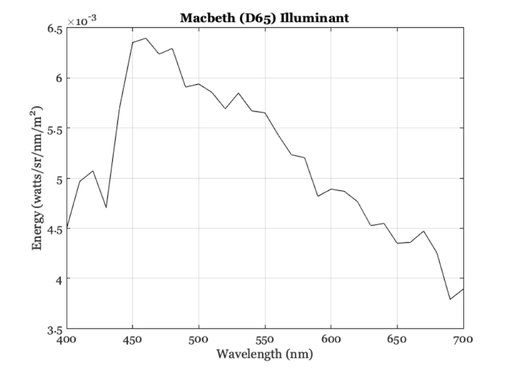
Scenes store information about the illuminant
scenePlot(scene,'illuminant energy');
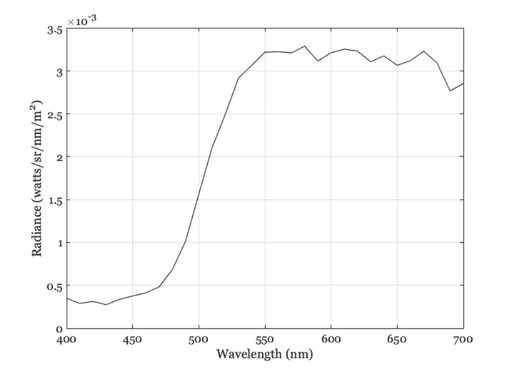
You can plot the spectral radiance energy from within an ROI
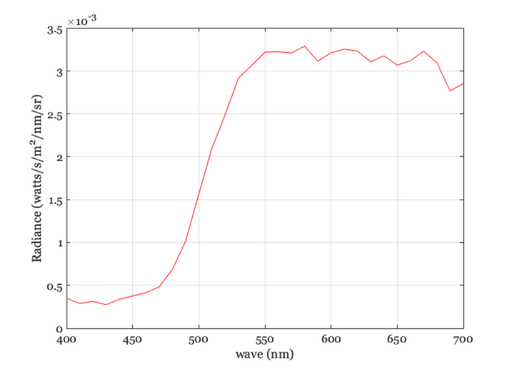
rect = [51    35    10    11];   % Yellow Macbeth patch
roiLocs = ieRect2Locs(rect);      % xy locations in scene
scenePlot(scene,'radiance energy roi',roiLocs);
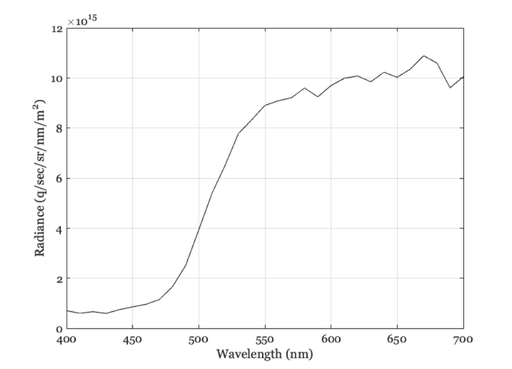
Or plot the mean quanta (photons) at the same location
scenePlot(scene,'radiance photons roi',roiLocs);
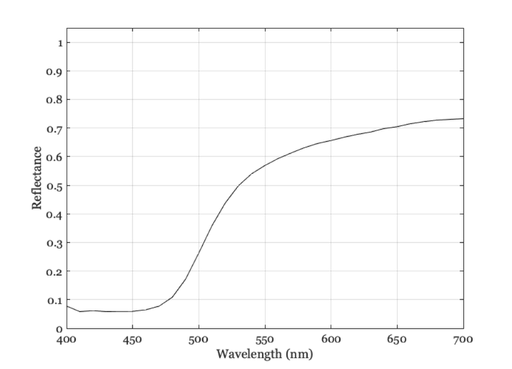
Or plot the reflectance
scenePlot(scene,'reflectance',roiLocs);
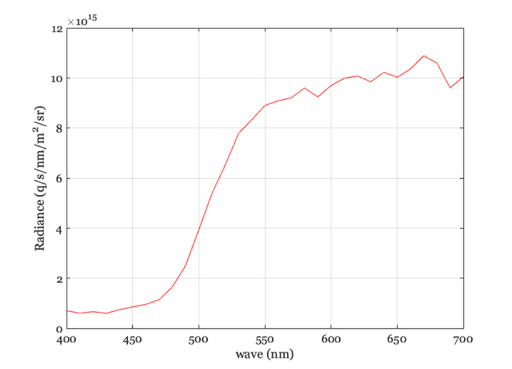
To read the photon data without plotting
radiance = vcGetROIData(scene,roiLocs,'photons');
radiance = mean(radiance);

wave = sceneGet(scene,'wave');
vcNewGraphWin;
plot(wave,radiance); grid on
xlabel('wave (nm)'); ylabel('Radiance (q/s/nm/m^2/sr)');
Or read the energy data
radiance = vcGetROIData(scene,roiLocs,'energy');
radiance = mean(radiance);

vcNewGraphWin;
plot(wave,radiance); grid on
xlabel('wave (nm)');
ylabel('Radiance (watts/s/m^2/nm/sr)');