Demonstrate ISET analyses for evaluating CIELAB color error
We use a Macbeth Color checker using an automated script.
The processing steps are
- Create an MCC scene
- Convert the scene to an optical image
- Create a sensor and image of the MCC
- Select the four outside corners of the MCC in the sensor image (stored already)
- Compute a best MSE linear transformation from sensor to MCC data
- Compute the processor image using the linear transform and evaluate the rendered data with respect to CIELAB and other simple error metrics.
You can alter parameters of the sensor or optics and see how this changes the CIELAB errors.
See also: macbethColorError, sceneAdjustLuminance, oiCompute, sensorSetSizeToFOV, ipCreate
Copyright ImagEval Consultants, LLC, 2010
Contents
ieInit;
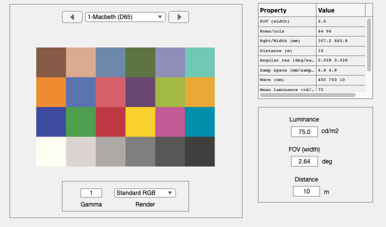
Set up a MCC scene
scene = sceneCreate;
scene_lum  = 75;       % mean luminance (candelas)
scene_fov  = 2.64;     % field of view (degrees)
scene_dist = 10;       % distance of imager from scene (m)
scene = sceneAdjustLuminance(scene,scene_lum);
scene = sceneSet(scene,'fov',scene_fov);
scene = sceneSet(scene,'distance',scene_dist);

% Show scene window
ieAddObject(scene); sceneWindow;
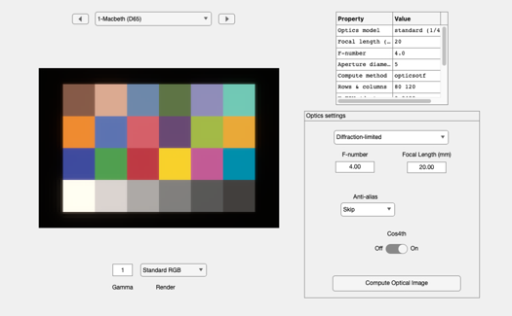
Optics
opt_fnumber = 4;        % f#
opt_flength = 20e-3; % 10e-3; % focal length in metres

% Initialize optics and create irradiance image of specified scene
oi     = oiCreate;
optics = oiGet(oi,'optics');
optics = opticsSet(optics,'fnumber',opt_fnumber);
optics = opticsSet(optics,'focallength',opt_flength);
optics = opticsSet(optics,'off axis method','skip');
oi     = oiSet(oi,'optics',optics);
oi     = oiCompute(oi,scene);

ieAddObject(oi);
oiWindow;
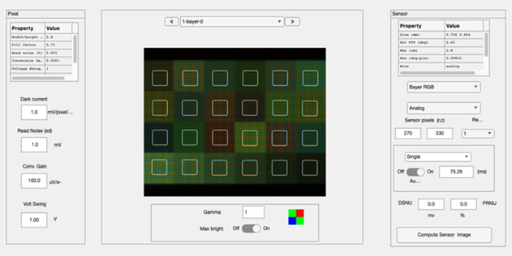
Sensor
Create an RGB color sensor, no IR filter.
sensor = sensorCreate;
% figure(1); plot(wave,filterSpectra)

% Match the sensor size to the scene FOV
sensor = sensorSetSizeToFOV(sensor,sceneGet(scene,'fov'),oi);

% Compute the image and bring it up.
sensor = sensorCompute(sensor,oi);
ieAddObject(sensor)
sensorWindow;

% Plot a couple of lines
%    sensorPlotLine(sensor,'h','volts','space',[1,115]);
%    sensorPlotLine(sensor,'h','volts','space',[1,116]);
%    sensorPlotLine(sensor,'h','volts','space',[1,117]);
ans =

     1

Define a good linear transformation from sensor to linear RGB display
% This routine asks you to select the locations of the outer
% boundaries of the MCC.  It returns the linear transform that
% converts the data to a nicely rendered D65 MCC.
cp = [
    1   244
    328   246
    329    28
    2    27];
sensor = sensorSet(sensor,'chart corner points',cp);
if ieNotDefined('sensorLocs')
    [L,sensorLocs] = sensorCCM(sensor,'macbeth');
else
    % If you already figured out sensorLocs, you can just run this
    [L,sensorLocs] = sensorCCM(sensor,'macbeth',sensorLocs);
end
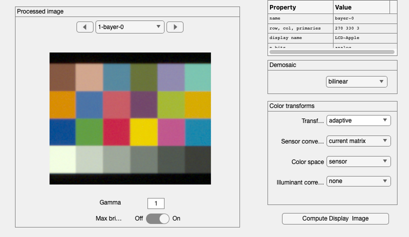
Create and set the processor window
vci = ipCreate;
vci = ipSet(vci,'scale display',1);
%
% Use the linear transformation derived from sensor space (above) to
% display the RGB image in the processor window.
vci = ipSet(vci,'conversion matrix sensor',L);
vci = ipSet(vci,'correction matrix illuminant',[]);%
vci = ipSet(vci,'internal cs 2 display space',[]);  % ICS 2 display
vci = ipSet(vci,'conversion method sensor','Current matrix');
vci = ipSet(vci,'internalCS','Sensor');

% First, compute with the default properties.  This uses bilinear
% demosaicing, no color conversion or balancing.  The sensor RGB values are
% simply set to the display RGB values.
vci = ipCompute(vci,sensor);
ieAddObject(vci);
ipWindow;

% If you want to change parameters in the GUI and examine the
% virtual camera image that is in the window, you can do this:
%     vci = vcGetObject('vci')

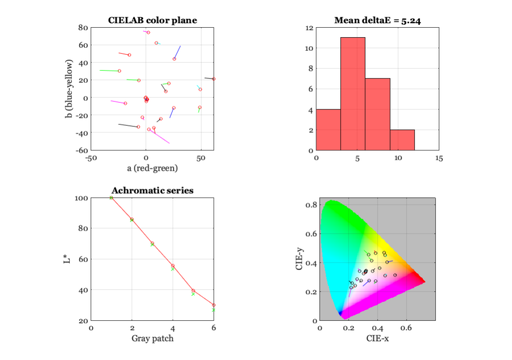
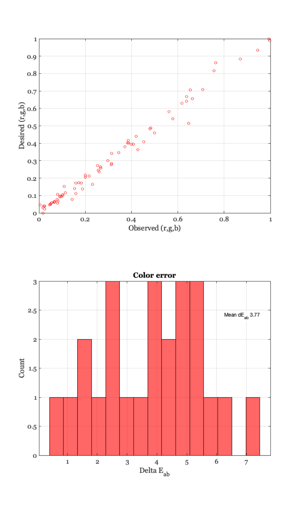
Evaluate the dE and other value sin the processor window
For the case in this script, the locations of the MCC are known and stored here.
pointLoc = ...
    [ 4   246
    328   243
    327    26
    3    27];

% If you change the size of the sensor or other spatial parameters, you may
% have to adjust these.  You can use this routine to interactively click on
% the four corners of the MCC.  See the message in the processor window
% that tells you the order to click on the corners.
%
%    [mRGB, mLocs, pSize, pointLoc] = macbethSelect(vci);

% This produces several evaluations of the errors in the plot.
[macbethLAB, macbethXYZ, deltaE] = macbethColorError(vci,'D65',pointLoc);

% You can get the raw data from the graphs using get(gcf,'userData')
%    ipGet(vci,'prodT')
%    T = ipGet(vci,'eachTransform')
%    T{1}
%    T{2}
%    T{3}
Converting rgb to XYZ values from an sRGB display