Review rendering images on a display (Psych 221)
  Class:     Psych 221/EE 362
  Tutorial:  Examples of rendering images
  Author:    Wandell
  Purpose:   Explain how to render illuminant and surface reflectance
             data on a screen.
  Date:      01.02.96
  Duration:  20 minutes
Contents
ieInit
Render the MCC on a monitor (match scanner)
% Load in the surface reflectances of the Macbeth ColorChecker. Also,
% we know the color appearance of a few of them so let's give them
% labels.

% load macbethChart;
fName = which('macbethChart.mat');
wave = 400:700;
macbethChart = ieReadSpectra(fName,wave);

% There are 24 surfaces, so we prepare a small matrix (6 by 4) with 24
% entries. Later, we will use this matrix to display the 24 surfaces.
% The way we will do the display is to build a colormap with 24 rows.
% Each row will describe the (r,g,b) values for one surface.

macbethImage = reshape(1:24,4,6);

% We can't display a pure surface.  We always need to display a
% surface under a particular light.  Hence, an important thing to
% remember during this rendering exercise is that we have chosen a
% particular light. Later, you might come back to this point and load
% in a different choice for a light.

% For now, load in the D65 illuminant and call it the lgt.

lgt = ieReadSpectra('D65',wave);

% Load data for a default monitor and the XYZ functions
%
d = displayCreate('OLED-Samsung','wave',wave);
phosphors = displayGet(d,'rgb spd');
XYZ = ieReadSpectra('XYZ',wave);
Render the MCC on a monitor (match XYZ)
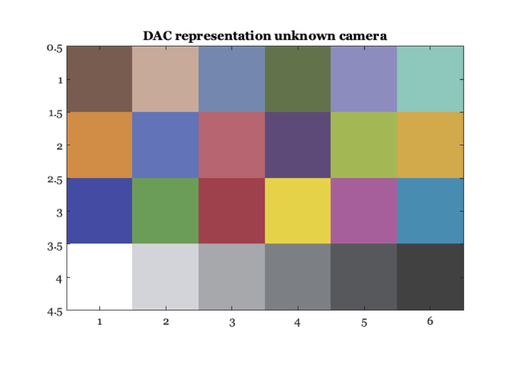
% First, compute the XYZ values of the macbeth colorchecker under the
% default illuminant.  These values describe how the human visual
% system will encode the light reflected from each of the surfaces.
% You should check that this calculation makes sense to you by writing
% it out as a matrix tableau.  Note the use of the diag() function
% ....

macbethXYZ = XYZ'* diag(lgt)* macbethChart;

% Here, we determine the linear RGB settings we will need in order to
% create the same XYZ values on the default monitor. Your monitor may
% not be the same, of course.

macbethLinearRGB = inv(XYZ'*phosphors)*macbethXYZ;

% Now, we haven't set any absolute units for this match.  For example
% we don't know what the absolute intensity of the light source is.
% In general, we can't match absolute intensities very well across
% viewing conditions.  For example, if the surface is outdoors the
% outdoor light intensity is several orders of magnitude greater than
% the possible output of the monitor.
%
% So, we are going to ignore the absolute intensities.  Instead, we
% are simply going to assume that the white surface will be the
% brightest element of the image.  Consequently, we are going to scale
% the RGB values so that the white surface corresponds to the largest
% displayable value.
macbethLinearRGB = macbethLinearRGB/(max(macbethLinearRGB(:)));

% We are representing the relationship between the linear RGB values
% and the RGB values in the frame-buffer using a look-up table that
% accounts for for the monitor nonlinearity.  This lookup table stores
% the inverse gamma function, and we have called it monitorInvGam
% (both here and in other tutorials). So, let's scale the RGB values
% so that they fall within the range set by that table.

% Now, we are going to use a trick that people often do -- just a
% trick, no deep principles here -- for setting the absolute levels.
% We are going to assume that:  THE WHITE SURFACE XYZ should
% correspond to the MONITOR DISPLAY AT [255,255,255]. This is not
% exactly right.  In fact, it is not right at all. If you have good
% calibration methods, you don't need to do this.  But, people rarely
% have good calibration methods so they do this. Let's carry on,
% though we will talk about this in class.

whiteChip = 4;
% Here are the RGB settings for the white chip
wht = macbethLinearRGB(:,whiteChip);

% Scale ALL of the RGB values so that the white chip has a framebuffer
% value that is roughly (1,1,1).
macbethLinearRGB = diag( (1 ./ wht )  ) * macbethLinearRGB;

% Correct for the monitor nonlinearity.
iGtable = displayGet(d,'inverse gamma');
RGB = XW2RGBFormat(macbethLinearRGB',4,6);
macbethRGB = rgb2dac(RGB,iGtable);

% There are 24 chips, and we have computed the proper display
% intensities for each one of them.  We place an image that consists
% of the list of values 1:24, into the frame-buffer.  We set the color
% table values to the proper r,g,b values.
%
macbethRGB = macbethRGB/max(macbethRGB(:));

% Now, we put up this 6 x 4 matrix and set the image to have the right
% color map.

ieNewGraphWin;
image(macbethRGB); axis image
title('DAC representation unknown camera')
% Voila.
Render the MCC on a monitor (match rgb)
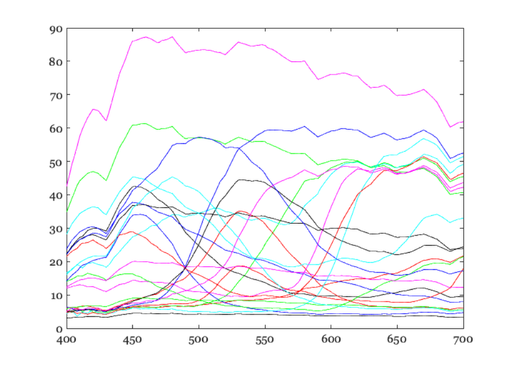
% Now, suppose that you don't know very much about either the display
% or, say, a digital camera that you used to acquire the data you want
% to display.  What do you do?

% Here, we are going to make some simulated rgb data from a digital
% camera. The strategy we will use to match the display and the
% original image is to MEASURE THE DISPLAY OUTPUT WITH THE DIGITAL
% CAMERA.  Then, we will try to adjust the display output so that it
% causes the same RGB signal at the camera as the original macbeth
% Color Checker image.

% Once again, we compute the color signal from the color checker under
% some light.

colorSignal = diag(lgt)*macbethChart;
ieNewGraphWin; plot(wave,colorSignal)

% For this simulation, we calculate the expected camera rgb signals
% from each of the color signals.

sensors = ieReadSpectra('cMatch/camera', wave);
cameraRGB = sensors'* colorSignal;

% Next, we need to know how the camera would respond to light from
% each of the monitor phosphors.  This will permit us to build a
% matrix that converts from the linear monitor intensities to the
% camera RGB responses. We will call this matrix mon2camera.  This
% will be a 3 x 3 matrix.  The first column describes the RGB values
% when the red phoshor is on, the second and third when the green and
% blue are on respectively.

% Experimentally, we could obtain these values just by taking a camera
% picture of the monitor.  For example, suppose we just turn on the
% red phosphor, and we use the camera to take a picture of the red
% phosphor.

% In this case, though, we know the sensors.  So, rather than asking
% you to do the experiment (but do it if you would like). However
% given that we know the sensors, we can compute this matrix simply
% as:

mon2camera = sensors'*phosphors;

% This tells us how to set the monitor (linear) RGB values in order to
% match a set of (linear) CAMERA RGB values.  N.B.  The human eye is
% not involved in this calculation.  We are adjusting the monitor
% output so that the camera will have the same responses.  There is no
% mention of people, CIE standards, or the like in any of this
% calculation.

camera2mon = inv(mon2camera)

% We now use the matrix camera2mon to compute the display rgb values

macbethCameraLinearRGB = camera2mon*cameraRGB;

% Again, to make a decent picture we will need to correct for the
% framebuffer nonlinearity.  And, we don't really have much choice
% about the absolute intensity of various quantities. So, let's
% perform the same set of calculations we did before in order to
% render a display.

macbethCameraLinearRGB = ...
    round(1000*macbethCameraLinearRGB/(max(macbethCameraLinearRGB(:))));

% Because we don't really know the properties of this display, we are
% going to arrange things so that the known white chip is displayed as
% the white of the monitor.  This is a cheap trick that often makes
% people and managers happy.
%
wht = macbethCameraLinearRGB(:,whiteChip);

macbethCameraLinearRGB = diag( (1 ./ wht )  ) * macbethCameraLinearRGB;
% macbethCameraLinearRGB = ieScale(macbethCameraLinearRGB,1,size(iGtable,1));
macbethCameraLinearRGB = ieScale(macbethCameraLinearRGB,1);
macbethCameraRGB = rgb2dac(macbethCameraLinearRGB',iGtable);

% There are 24 chips, and we have computed the proper display
% intensities for each one of them.  We place an image that consists
% of the list of values 1:24, into the frame-buffer.  We set the color
% table values to the proper r,g,b values.
%
macbethCameraColorMap = ieScale(macbethCameraRGB,1);
ieNewGraphWin; colormap(macbethCameraColorMap)
image(macbethImage); axis image
title(sprintf('Rendered for simulated camera.'))
camera2mon =

   76.2953   -1.4488   -0.5081
   -0.7640   79.0383   -4.1413
   -0.0857   -1.9754   82.5339