Illustrate CIE xy chromaticity calculations and plots
Chromaticity coordinates are widely used to summarize the hue and saturation of a light. We calculate the chromaticity coordinates and the gamut of light from a display.
See also: chromaticityPlot, displayCreate, displayPlot
Copyright ImagEval Consulting, LLC 2011
Contents
ieInit
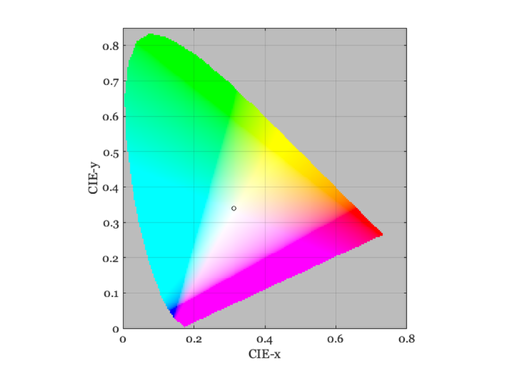
Example of a display chromaticity analysis
% Create a display object and plot its white point
dFilename = 'lcdExample';
display = displayCreate(dFilename);
wPoint = displayGet(display,'white XYZ');
chromaticityPlot(chromaticity(wPoint));

% Show the white point
chromaticityPlot(displayGet(display,'white xy'));

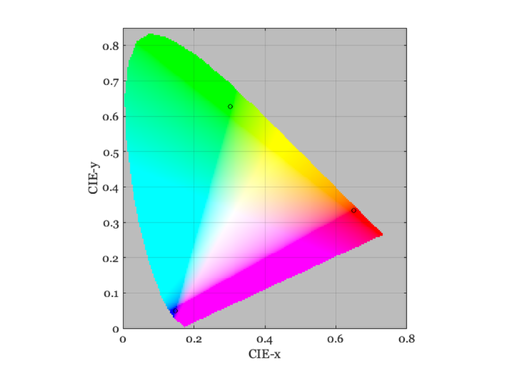
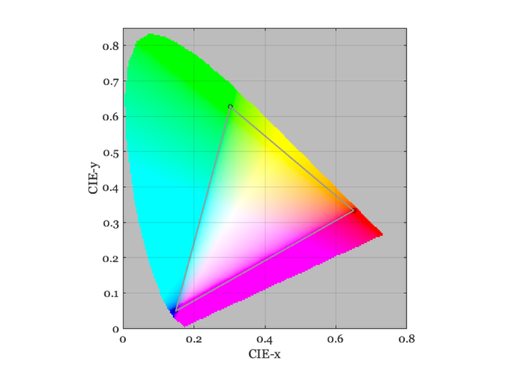
Show the chromaticity points of the primaries
spdXYZ = displayGet(display,'primaries xyz');
chromaticityPlot(chromaticity(spdXYZ));

% You can also plot the gamut with the lines this way
displayPlot(display,'gamut');
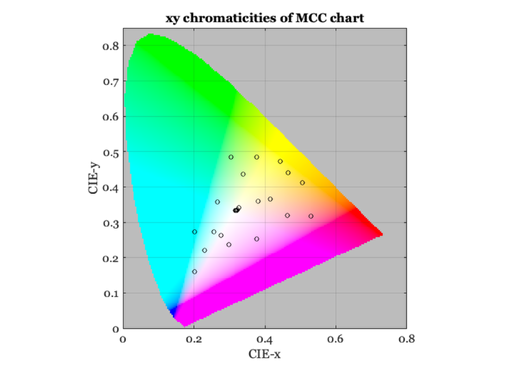
Example of a scene chromaticity analysis
% A macbeth color chart
scene = sceneCreate;
xyz = sceneGet(scene,'xyz');
xyz = RGB2XWFormat(xyz);
chromaticityPlot(chromaticity(xyz));
title('xy chromaticities of MCC chart')