Contents
Generate problem data
randn('state', 0);
rand('state', 0);
n = 100;
P = rand(n);
P = P + P';
[V D] = eig(P);
P = V*diag(1+rand(n,1))*V';
q = randn(n,1);
r = randn(1);
l = randn(n,1);
u = randn(n,1);
lb = min(l,u);
ub = max(l,u);
Solve problem
[x history] = quadprog(P, q, r, lb, ub, 1.0, 1.0);
iter	    r norm	   eps pri	    s norm	  eps dual	 objective
  1	    5.4585	    0.0508	    4.9772	    0.0556	    -23.62
  2	    2.0050	    0.0546	    0.8151	    0.0734	    -10.06
  3	    1.2096	    0.0558	    0.2823	    0.0845	     -4.36
  4	    0.7197	    0.0562	    0.1188	    0.0912	     -0.39
  5	    0.4287	    0.0564	    0.0578	    0.0952	      2.14
  6	    0.2564	    0.0564	    0.0331	    0.0976	      3.70
  7	    0.1541	    0.0564	    0.0199	    0.0990	      4.64
  8	    0.0931	    0.0564	    0.0120	    0.0999	      5.21
  9	    0.0566	    0.0564	    0.0073	    0.1004	      5.55
 10	    0.0345	    0.0564	    0.0044	    0.1007	      5.75
Elapsed time is 0.019595 seconds.
Reporting
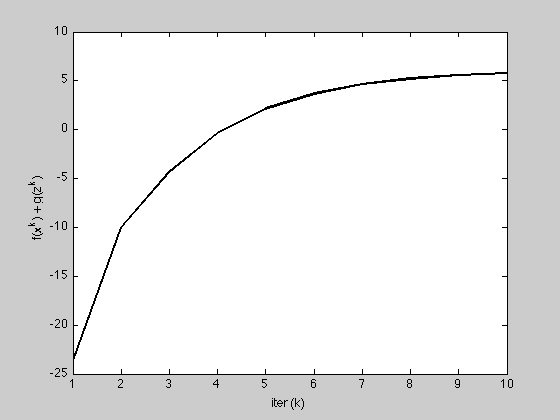
K = length(history.objval);
h = figure;
plot(1:K, history.objval, 'k', 'MarkerSize', 10, 'LineWidth', 2);
ylabel('f(x^k) + g(z^k)'); xlabel('iter (k)');
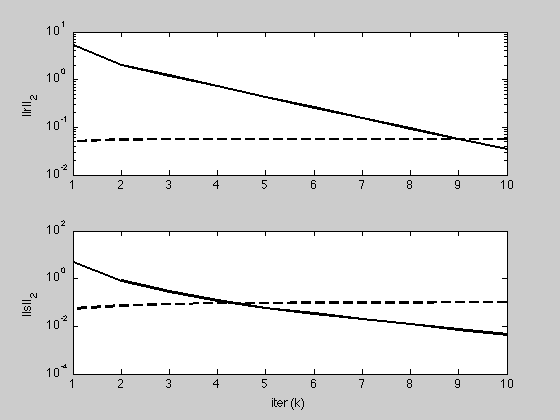
g = figure;
subplot(2,1,1);
semilogy(1:K, max(1e-8, history.r_norm), 'k', ...
1:K, history.eps_pri, 'k--', 'LineWidth', 2);
ylabel('||r||_2');
subplot(2,1,2);
semilogy(1:K, max(1e-8, history.s_norm), 'k', ...
1:K, history.eps_dual, 'k--', 'LineWidth', 2);
ylabel('||s||_2'); xlabel('iter (k)');