Contents
Generate problem data
rand('seed', 0);
randn('seed', 0);

n = 30;
m = 10;
A = randn(m,n);

x = sprandn(n, 1, 0.1*n);
b = A*x;

xtrue = x;
Solve problem
[x history] = basis_pursuit(A, b, 1.0, 1.0);
iter	    r norm	   eps pri	    s norm	  eps dual	 objective
  1	    2.1455	    0.0240	    0.3756	    0.0220	      9.49
  2	    1.2821	    0.0246	    1.5779	    0.0332	      8.62
  3	    0.7697	    0.0326	    1.2111	    0.0354	      7.98
  4	    0.8756	    0.0371	    0.5554	    0.0368	      8.45
  5	    0.7662	    0.0373	    0.3617	    0.0382	      8.73
  6	    0.3543	    0.0349	    0.5447	    0.0387	      7.41
  7	    0.2137	    0.0334	    0.4236	    0.0381	      7.25
  8	    0.3035	    0.0329	    0.1683	    0.0374	      7.71
  9	    0.2479	    0.0327	    0.0969	    0.0371	      7.45
 10	    0.1514	    0.0328	    0.1500	    0.0371	      6.97
 11	    0.1002	    0.0329	    0.1479	    0.0373	      6.63
 12	    0.0870	    0.0328	    0.1249	    0.0375	      6.56
 13	    0.0840	    0.0327	    0.1039	    0.0378	      6.57
 14	    0.0804	    0.0325	    0.0895	    0.0380	      6.57
 15	    0.0774	    0.0324	    0.0715	    0.0381	      6.60
 16	    0.0711	    0.0324	    0.0610	    0.0381	      6.62
 17	    0.0590	    0.0325	    0.0522	    0.0380	      6.57
 18	    0.0513	    0.0326	    0.0477	    0.0381	      6.53
 19	    0.0452	    0.0327	    0.0443	    0.0381	      6.50
 20	    0.0424	    0.0329	    0.0394	    0.0381	      6.51
 21	    0.0426	    0.0329	    0.0323	    0.0381	      6.51
 22	    0.0433	    0.0329	    0.0248	    0.0381	      6.51
 23	    0.0417	    0.0328	    0.0214	    0.0381	      6.50
 24	    0.0373	    0.0327	    0.0240	    0.0382	      6.48
 25	    0.0319	    0.0326	    0.0277	    0.0382	      6.45
Elapsed time is 0.003487 seconds.
Reporting
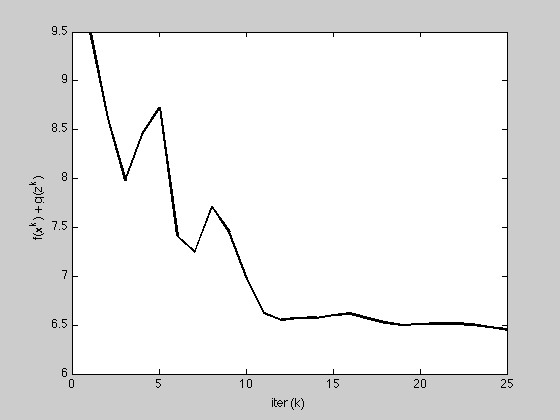
K = length(history.objval);

h = figure;
plot(1:K, history.objval, 'k', 'MarkerSize', 10, 'LineWidth', 2);
ylabel('f(x^k) + g(z^k)'); xlabel('iter (k)');

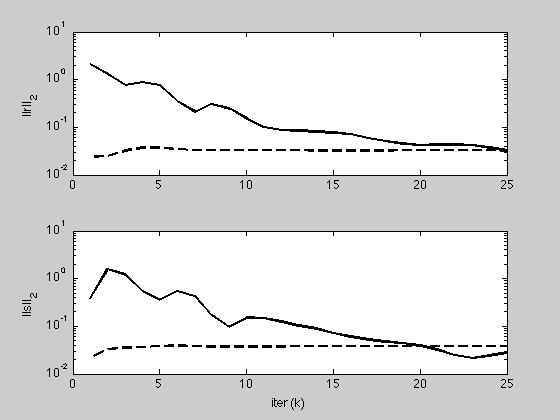
g = figure;
subplot(2,1,1);
semilogy(1:K, max(1e-8, history.r_norm), 'k', ...
    1:K, history.eps_pri, 'k--',  'LineWidth', 2);
ylabel('||r||_2');

subplot(2,1,2);
semilogy(1:K, max(1e-8, history.s_norm), 'k', ...
    1:K, history.eps_dual, 'k--', 'LineWidth', 2);
ylabel('||s||_2'); xlabel('iter (k)');


