The word for this project is algorithmic. This project builds a neat algorithm that uses Python on masses of data. There is also a smaller HW7b program. All parts of HW7 are due Wed Mar 5th at 11:55pm. Download ghost.zip to get started.
We have a few warmups functions to get ready for the Ghost problem. These all have a 1-line solution using lambda.
> lambdahw
Turn In Turn In Warmups to Paperless
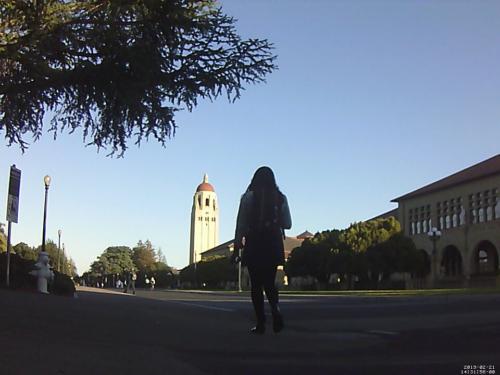
Suppose we are trying to take a picture of Stanford, but each image has people walking through the scene, like this (this is the "hoover" data set):

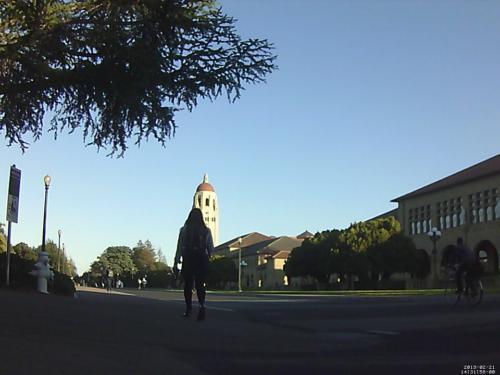
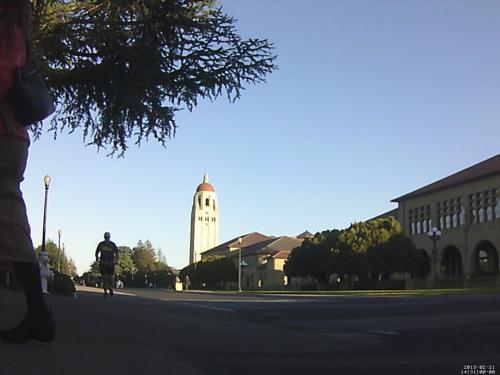
We'd like to look through all these images and figure out an image that "ghosts" out all the people and just shows the background.
This assignment depends on the "Pillow" module you installed for an earlier. Instructions for installing Pillow are included at the end of this document if necessary.
For this assignment, we'll access the color of each pixel as a "color tuple" — a len-3 tuple like (56, 213, 20), containing the red, green, and blue values to define an RGB color. The SimpleImage module supports getting and setting the color of any x,y pixel using these color-tuples with the get_color_tuple() and set_color_tuple() functions. For this assignment, algorithms that work on colors and any reference to a "color" will mean these len-3 color tuples.
Say we have 4 images. For every x,y consider the 4 pixels at that x,y across all the images. Many of those pixels show the proper "true" color for that pixel, and a few pixels have someone walking in front, which we'll call "outlier" pixels. We'll assume that outlier pixels are not the majority for any x,y.
With 4 images, suppose the 4 colors at x=100 y=50 across the images ook like:
[(1, 1, 1), (1, 1, 1), (28, 28, 28), (1, 1, 1)]
Looking at the colors, you can guess that (28, 28, 28) is the outlier and (1, 1, 1) is the true color since it's the color that appears for the majority of the pixels. What's an algorithm to figure out the true color for an x,y?
To frame this problem, it's handy to introduce the idea of "color distance" between 2 colors. You can think of each color as a point in a 3-dimensional color space, with red-green-blue coordinates instead of the regular x-y-z coordinates.
For reference, the standard formula for distance in x-y-z space is (in Python syntax):
math.sqrt(x_difference ** 2 + y_difference ** 2 + z_difference ** 2)
Reminder: In Python "**" is exponentiation, so (x ** 2) is x squared. The module named "math" contains miscellaneous math functions, and math.sqrt() is the square root function. As a surprising optimization, we can actually omit the math.sqrt() for this algorithm (explained below).
There are a few ways to solve the Ghost problem, but the following is a relatively simple approach that works well.
Problem: for any particular x,y, look at all the colors across all the images at that x,y. We want to pick out the best color to use, avoiding any outlier colors. We assume that the majority of colors are not outliers.
1. Compute the floating point arithmetic color tuple across these colors - average all the red values to get average-red-value, and likewise compute the average-green-value and average-blue-value. So for example, the three colors (1, 1, 1), (1, 1, 31), (28, 28, 28) would define an average of (10.0, 10.0, 20.0). It's fine to use a simple loop/add/divide with a few variables to compute this, not requiring a map/lambda approach.
To think through the next step, suppose we are looking at all the colors for an x,y. Imagine the colors scattered in a 2D space of colors.
The non-outlier colors will naturally cluster, grouped around the true color for that x,y, but displaced by little measurement errors. Any outlier colors will be off by themselves. The average will be in between the two, but nearer to the cluster, since the cluster has relatively more colors than any outliers.
2. To select the best among the colors, select the color with the least distance to the average of all the colors. Equivalently we could say select the color closest to the average. This works because the more numerous true colors are near the average, while any outlier colors are relatively far from the average.
In order to select the closest pix, we can omit the math.sqrt(), which is great because square-root is a relatively slow math operation. Here's why: suppose we have three pix, and their distances from average are 4, 6, and 9. We would select the distance "4" one as the closest. However, that works the same if distances are squared, which would be 16, 36, and 81 - we select the "16" one. Computing the square root was unnecessary to selecting the one with the least distance. Therefore, in the code below, we'll compute the distance squared instead of the distance, and in fact using distance-squared is a standard big-data technique for just this reason.
Three functions are specified below and are stubbed out in the starter code. You will need to write some additional helper functions as well.
Write the code for a color_dist2() function which returns the distance-squared between 2 color tuples. Write at least 2 Doctests for this function.
def color_dist2(color1, color2):
    """
    Returns the square of the color distance between two color tuples.
    Doctests TBD
    """
This is a low-level function, whose role is to be called by other functions. Often in our programs, the low-level functions are first in the file, called by the functions later in the file.
Write the code for a best_color() function which takes in a list of one or more colors and returns the best color from that list according to the ghost algorithm. For example with the colors [(1, 1, 1), (1, 1, 1), (28, 28, 28)] this should return (1, 1, 1). Write at least 2 Doctests. One of the Doctests must have more than 3 colors in the input. (See below for a helper function to support best_color().)
Design constraint: best_color() should not itself loop through the colors to compare distances. Instead, it should leverage lambda to pick out the best color.
def best_color(colors):
    """
    Given a list of 1 or more colors, returns the best color.
    """
If multiple colors qualify as the best, the code is free to pick any one of them. We'll call this the "best" color, and then in a later stage we'll work to make it better.
Looking at the algorithm for best_color() suggests the need for an average_color() helper function — given a list of color tuples, compute an average color tuple where the red value is the average of all the red values, the green is the average of all the green values, and so on.
# average color
[(1, 1, 1), (2, 2, 2), (3, 3, 3), (0, 4, 2)] -> (1.5, 2.5, 2.0)
The starter code does not include this function, so put it in yourself, including """Pydoc""". The """Pydoc""" can just be a sentence or two explaining what the function produces with its inputs. Also write at least 2 Doctests. Do not use the same number for the red/green/blue values for all the colors, e.g. (1 1 1), as this will not detect certain common red/green/blue bugs. Use a few different numbers. This is the "top down" decomposition direction, where working on a function like best_color(), you think up a helper that would be handy. The numbers in the computed average color should be floating point as shown above.
Your Doctest runs may produce funny looking floating point numbers like 1.25000000000001. This is a quirk of the floating point number system and does not indicate an error in your algorithm. In this case, you may want to change your Doctest input numbers slightly until the function produces round-looking floating point results, such as the 1.5 above. We will talk about this floating-point quirk in lecture.
Looking at the the whole ghost program output for, say, the hoover case, it's hard to tell for sure if the program is working correctly. In contrast, best_color() has been made testable by stripping it down to the minimum - a list of colors goes in, one color comes out. That form is so simple, it can be tested and made correct. Once best_color() is correct, the program routes this river of data through that one, well-tested function.
Cultural aside: this Sesame Street song is weirdly reminiscent of the Ghost algorithm.
This is a high level function, solving the whole problem by calling other functions to solve sub-problems. def solve(images, mode): """ Given a list of image objects and mode, compute and show a Ghost solution image based on these images. Mode will be None or '-good'. There will be at least 3 images and they will all be the same size. """
Here are the basic steps. Ignore the mode parameter for now, which is used in a later section.
1. Create a blank solution image the same size as the first image in the list
2. Loop over all the x,y
3. For each x,y, figure out the best color for that x,y (helper function, next section)
4. Set the solution image to use the computed best color for each x,y
5. Finally, put the solution image on screen with solution.show()
Create a blank solution image the same size as the first image in the list. Loop over all the x, y, for each x,y compute the best color, set that color into the solution for that x,y. Call solution.show() last to put the solution on screen.
    solution = SimpleImage.blank(width, height)
    ...
    # do all the work
    ...
    solution.show()
Decompose out a colors_at_xy(images, x, y) helper function that takes in the list of images and an x, y, and returns a list of all the color tuples at that x, y, pulled from the many images. This diagram, repeated from above, outlines the action of colors_at_xy():
This makes a nice helper function to support solve(). This function is not in the starter code, so create it with """Pydoc""". It is not easy to write Doctests for this function, so we will not have them here (the Doctest would require a list of images which would require more code to put together). However, without the benefit of Doctests, this function is more prone to bugs. Give your code here some extra scrutiny. The code should return a list of color tuples, each color tuple drawn from a different image.
The provided SimpleImage module has two functions that access image data in the "color-tuple" format of (red, green, blue) tuples. The old get_pixel() function works too, but for this project, do everything with color-tuples - get_color_tuple() and set_color_tuple().
SimpleImage Features:
Create image:
  image = SimpleImage.blank(400, 200)   # create new image of size
  image = SimpleImage('foo.jpg')        # create from file

Access size
  image.width, image.height
  image.in_bounds(x, y)      # boolean test

Get color tuple at x,y
  color = image.get_color_tuple(x, y)
  # color is RGB tuple like (100, 200, 0)

Set color at x,y
  image.set_color_tuple(x, y, color)

Show image on screen
  image.show()
Once solve() is coded, you can run your program from the command line. The ghost.py program takes one command line argument — the name of the folder (aka "directory") that contains the jpg files. The folder "hoover" is relatively small, containing the three jpg files (the three example images at the top of this page). Run the program with the "hoover" files like this:
$ python3 ghost.py hoover
hoover/200-500.jpg
hoover/158-500.jpg
hoover/156-500.jpg
(solution image appears)
The provided main() first looks in the folder, loads all the jpg files within the folder, and prints the filename of each image as it goes. Then main() calls your solve() function, passing in the images so it can solve the problem.
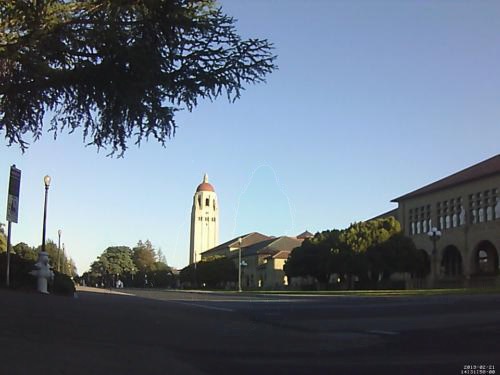
We have bigger and better campus cases to try in the folders clock-tower and math-corner. For any of these, you can look at the individual images inside the folder to get a feel for the data. The file naming convention here is that the file "foo-500.jpg" is 500 pixels wide.
Here's a medium sized case by the clock tower.
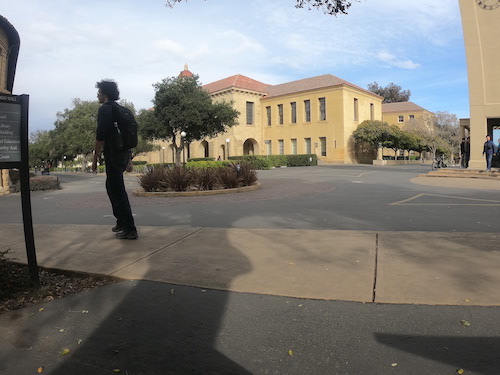
$ python3 ghost.py clock-tower
A larger case by math corner. Make sure your code can solve these cases before proceeding to the monster case below.
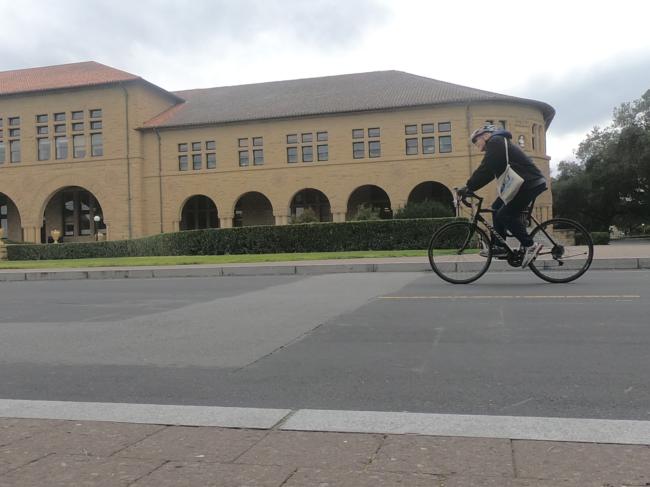
$ python3 ghost.py math-corner
Finally we have the "monster" case - nine large images again in the direction of of Hoover tower. It turns out, there are enough bad pixels in these inputs that the best_pix() does not quite produce perfect output. Run it with the command line below
$ python3 ghost.py monster
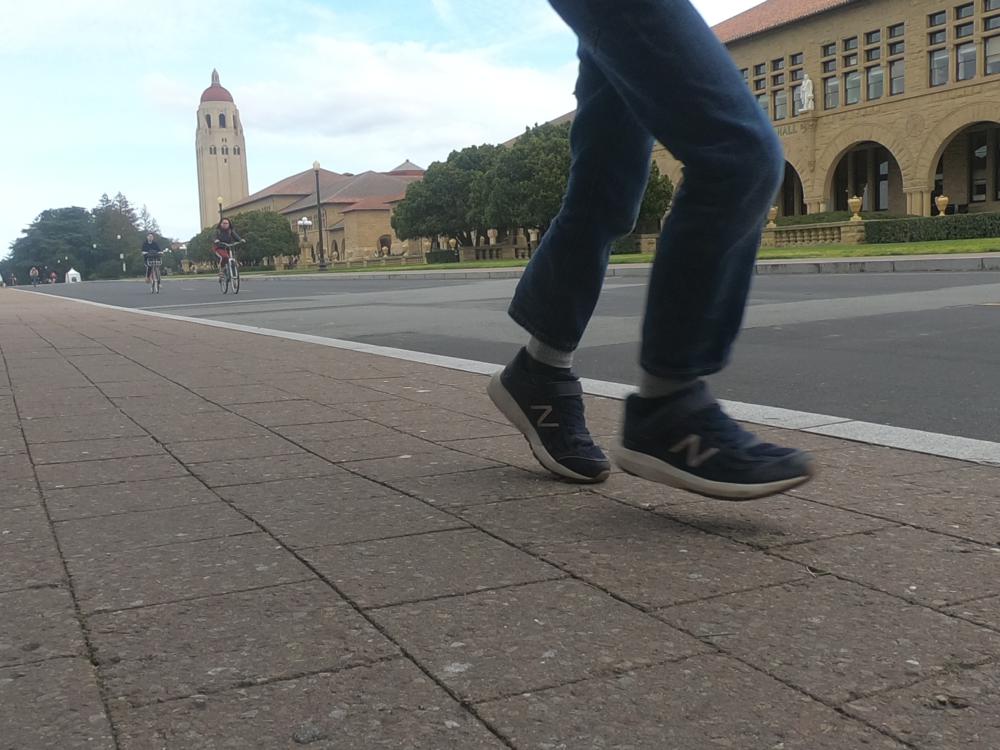
At first glance the output looks ok, but if you zoom in on the road and look very carefully, you can see several shadowy bike outlines.
For the last part of this program, you will fix the shadow bicycles with a more sophisticated "good apple" strategy.
To say that there are a few "bad apples" in a group suggests that if we just avoided the bad apples, we would have a good group. That will be the strategy to solve the difficult monster problem.
Here is the good-apple strategy: given a list of at least 2 colors. Consider the average of these colors, as before. Consider a sorted list of the colors in increasing order of their distance from the average, so the closest to the average is first in the list and the farthest is last (you can do this with one line of dense code). The first half of this list contains the "good" apples and the bad apples are in the second half of the list. Use a slice to compute a "good" list made of the first half of the list. Use the rounded-down midpoint (int division //) as beginning of the bad half. So for example if the list is length 6 or 7, the first 3 elements (index 0, 1, 2) are the good half. Then use your earlier best_color() algorithm to select the best from this "good" list.
Write code in the good_apple_color() function to implement the good apple strategy. Calling your helper functions here keeps the code relatively short. The code here has a similar structure to your earlier best_pix() function. Hint: when you need to compute the best color from among the good colors ... there is a one line way to do that.
One Doctest for good_apple_color() is provided and that's enough. It shows a case where there are so many bad colors that the best_color() algorithm alone is insufficient, but the good-apple strategy is able to pick out a good looking color.
>>> good_apple_color([(18, 18, 18), (0, 2, 0), (19, 23, 18),
                     (19, 22, 18), (19, 22, 18), (1, 0, 1)])
(19, 22, 18)
Go back to the solve() function. Add logic in the loop so if the mode is equal to '-good' then it uses good_apple_color() to compute and set the solution for each x,y. If the mode is None, then code should use best_color(). Mode will always be one of those two values.
When the program is run with -good on the command line, the mode '-good' is passed into solve(). Run the following command line to try your good apple strategy. It should be able to solve the difficult monster input better than before.
$ python3 ghost.py -good monster
The -good mode should take more time to run, since it sorts n colors for each x,y, and sorting is a little bit more expensive than the best_color() computation.
The monster images are each 1000 x 750 and there are 9 image files, and each pixel has the 3 RGB numbers. How many numbers is that?
>>> 1000 * 750 * 9 * 3
20250000
Your code is sifting through some 20 million numbers to solve the monster image.
When your code is cleaned up and works correctly, that's a very algorithmic core coded up with Python functions and lambdas. You'll turn in your ghost.py with the part-b project.
This project will use the "Pillow" library. The Pillow library may already be installed on your machine from an earlier homework. The steps below will install Pillow if needed.
Open a "terminal" window - the same type of window where you type "python3 foo.py" to run programs. The easiest way to get a Terminal is open the Ghost project in PyCharm, and use the "terminal" tab to the lower left. Type the following command (shown in bold as usual). Note that "Pillow" starts with an uppercase P. (On windows, typically "py" instead of "python3").
$ python3 -m pip install Pillow
..prints stuff...
Successfully installed Pillow-5.4.1
To test that Pillow is working, type the following command to a terminal inside your homework folder. This runs the "simpleimage.py" code included in the folder. When run like this, simpleimage.py creates and displays a big yellow rectangle with green at the right edge, showing that Pillow is installed and working correctly.
# (inside your project folder)
$ python3 simpleimage.py
# yellow rectangle appears
John Nicholson create the "Pesky Tourist" Nifty Assignment which inspired this project, see nifty.stanford.edu. Nick Parlante re-framed it to use lambda sorting and Doctests, and later on adding the good-apple algorithm to get even better output and re-use the helper functions.