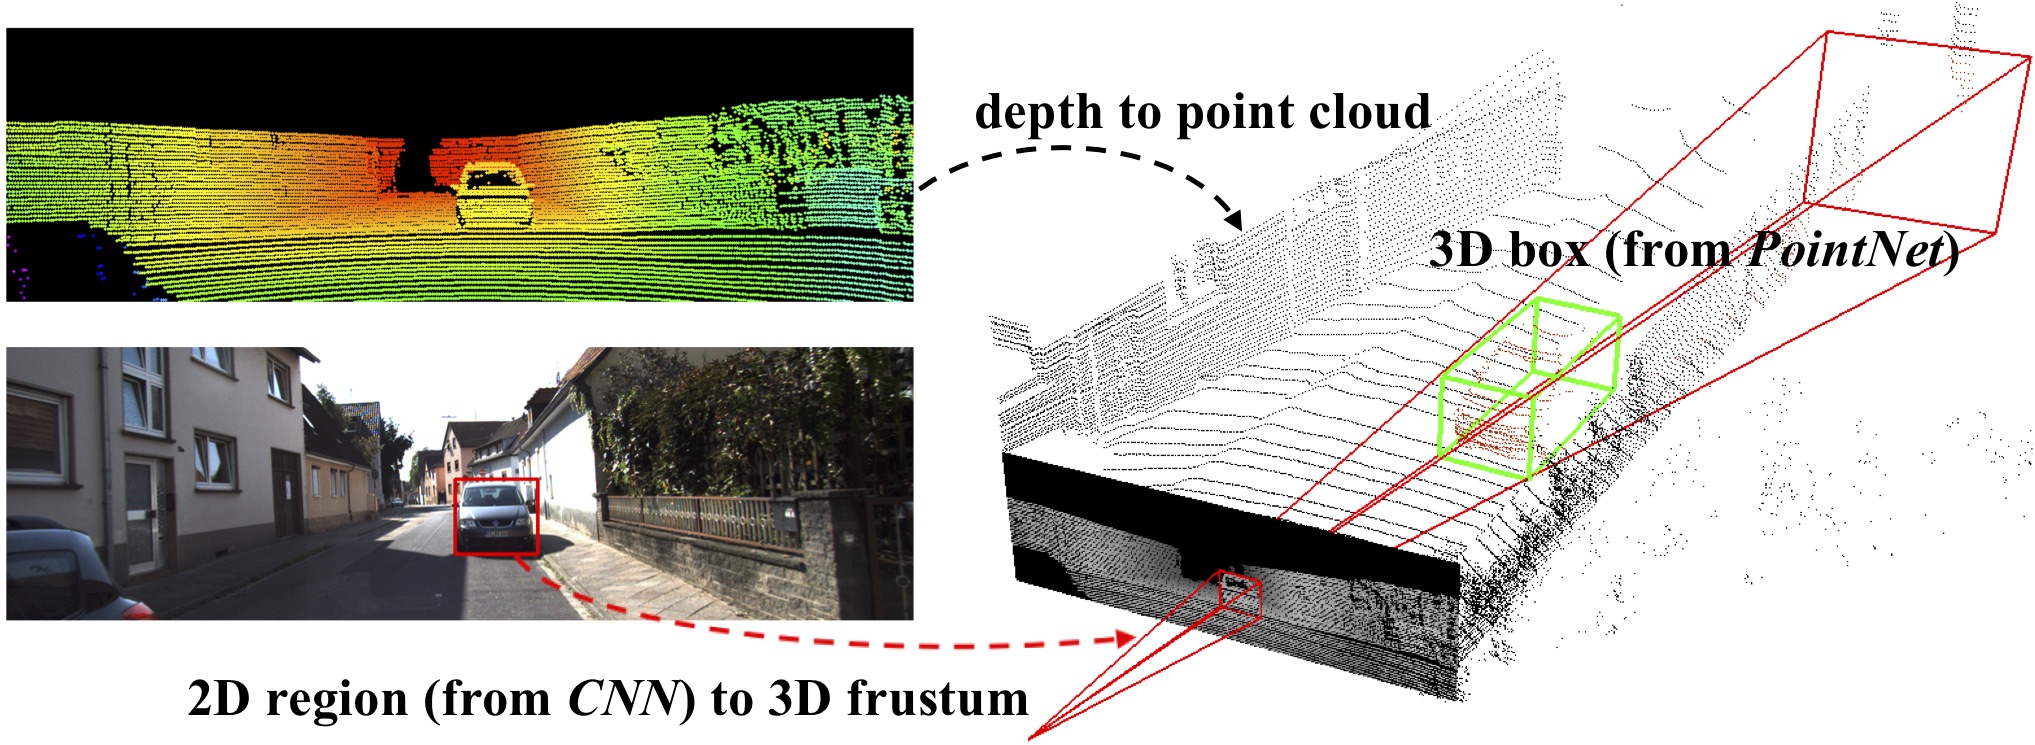
Figure 1. 3D object detection. Given RGB-D data, we first generate 2D object region proposals in the RGB image using a CNN. Each 2D region is then extruded to a 3D viewing frustum in which we get a point cloud from depth data. Finally, our frustum PointNet predicts a (oriented and amodal) 3D bounding box for the object from the points in frustum. |
In this work, we study 3D object detection from RGB- D data in both indoor and outdoor scenes. While previous methods focus on images or 3D voxels, often obscuring nat- ural 3D patterns and invariances of 3D data, we directly operate on raw point clouds by popping up RGB-D scans. However, a key challenge of this approach is how to effi- ciently localize objects in point clouds of large-scale scenes (region proposal). Instead of solely relying on 3D propos- als, our method leverages both mature 2D object detec- tors and advanced 3D deep learning for object localization, achieving efficiency as well as high recall for even small ob- jects. Benefited from learning directly in raw point clouds, our method is also able to precisely estimate 3D bound- ing boxes even under strong occlusion or with very sparse points. Evaluated on KITTI and SUN RGB-D 3D detection benchmarks, our method outperforms the state of the art by remarkable margins while having real-time capability.
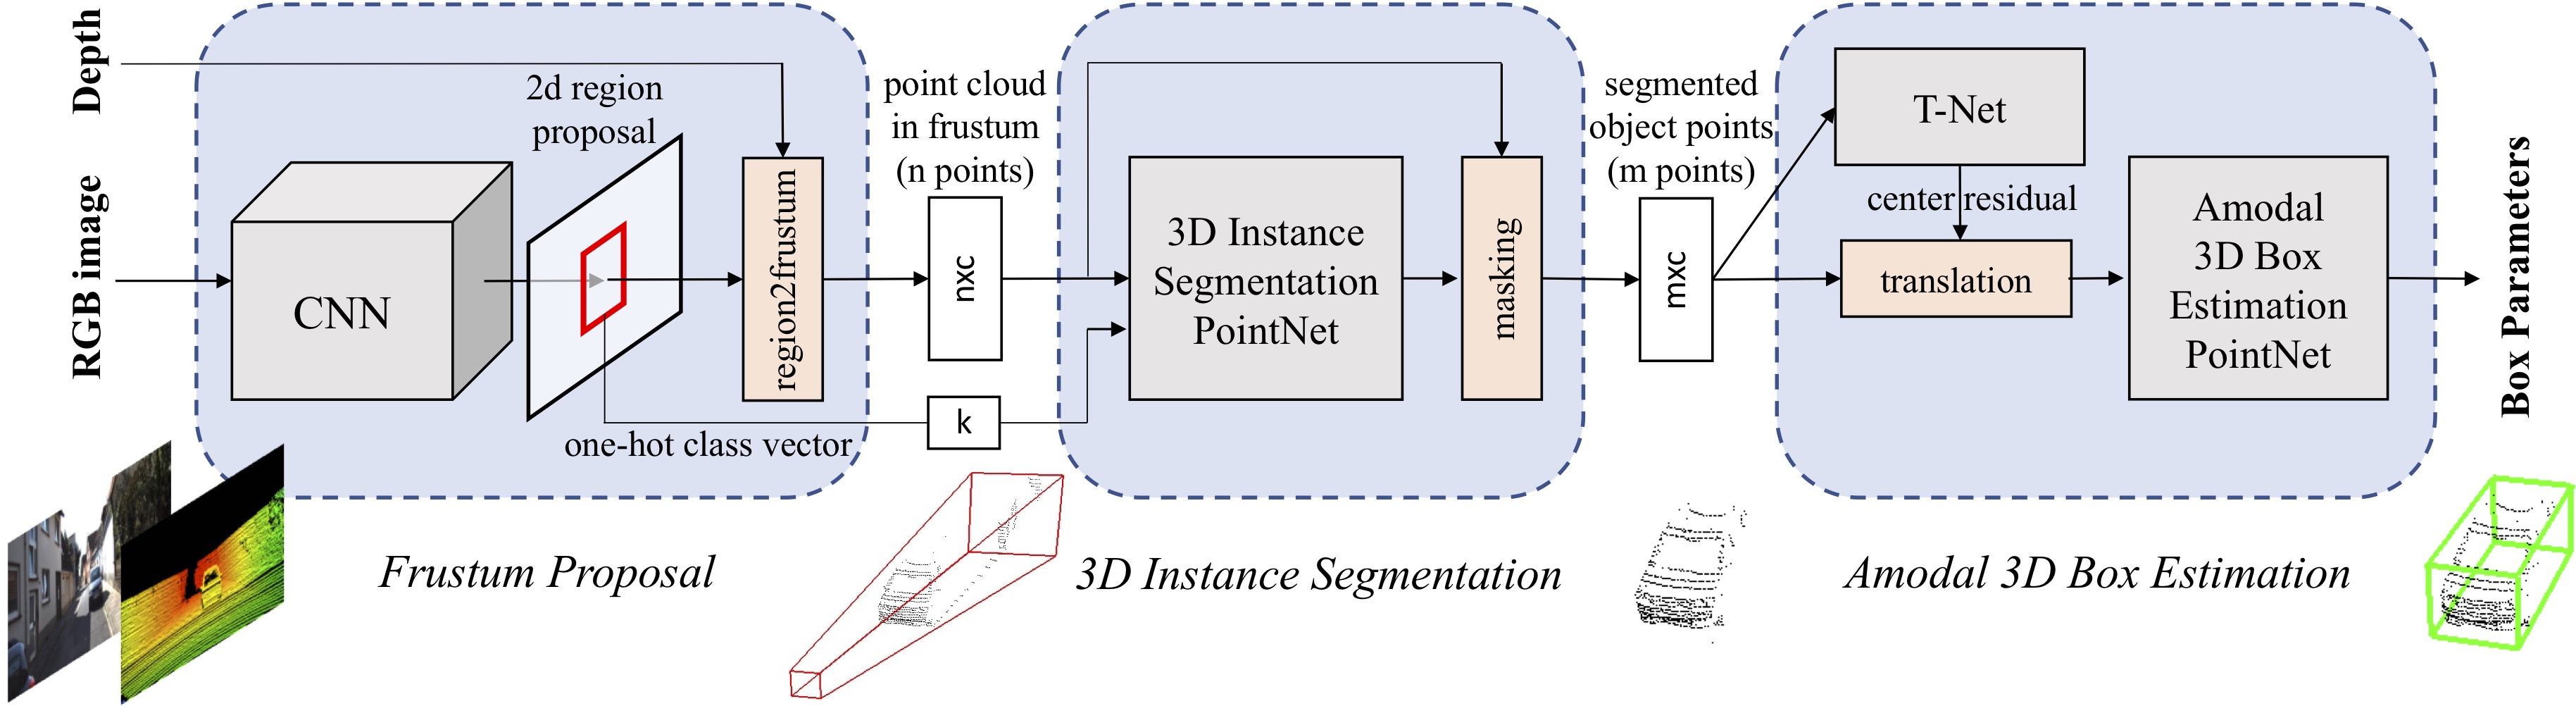
Figure 2. Pipeline of Frustum PointNets for 3D object detection. We first leverage a 2D CNN object detector to propose 2D regions and classify their content. 2D regions are then lifted to 3D and thus become frustum proposals. Given a point cloud in a frustum (n × c with n points and c channels of XYZ, intensity etc. for each point), the object instance is segmented by binary classification of each point. Based on the segmented object point cloud (m × c), a light-weight regression PointNet (T-Net) tries to align points by translation such that their centroid is close to amodal box center. At last the box estimation net estimates the amodal 3D bounding box for the object. |
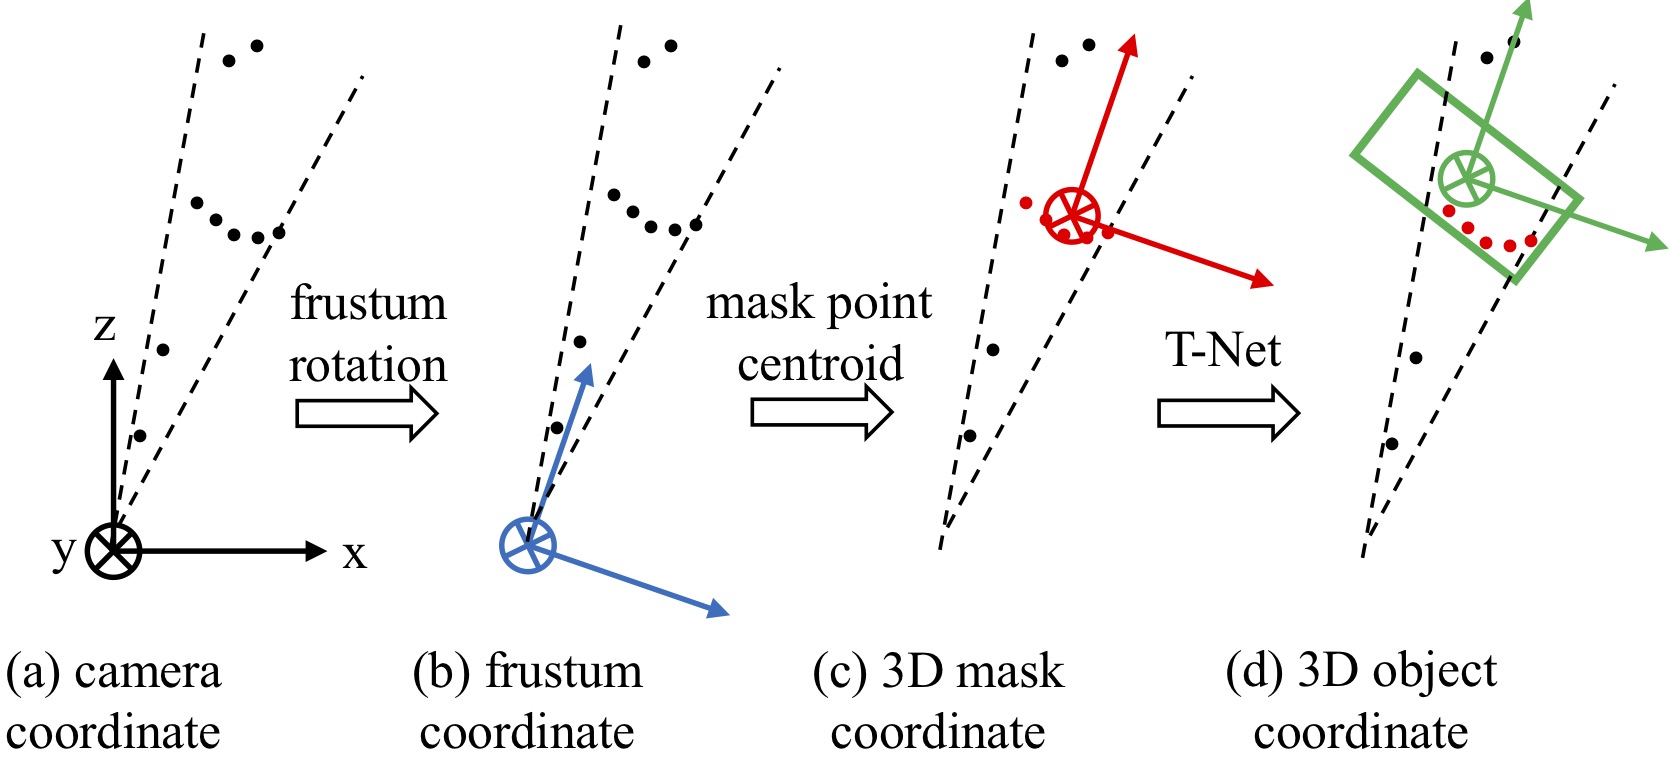
Figure 3. Coordinate systems for point cloud. A series of coordinate normalizations is key to our model's success. Point cloud by its nature is determined largely by XYZ values of the points, so it is critical to choose a ''good'' coordinate system. By our both non-parametric and network-based transformations, we are moving the points into more and more canonical spaces, which has a great positive effect on learning. |
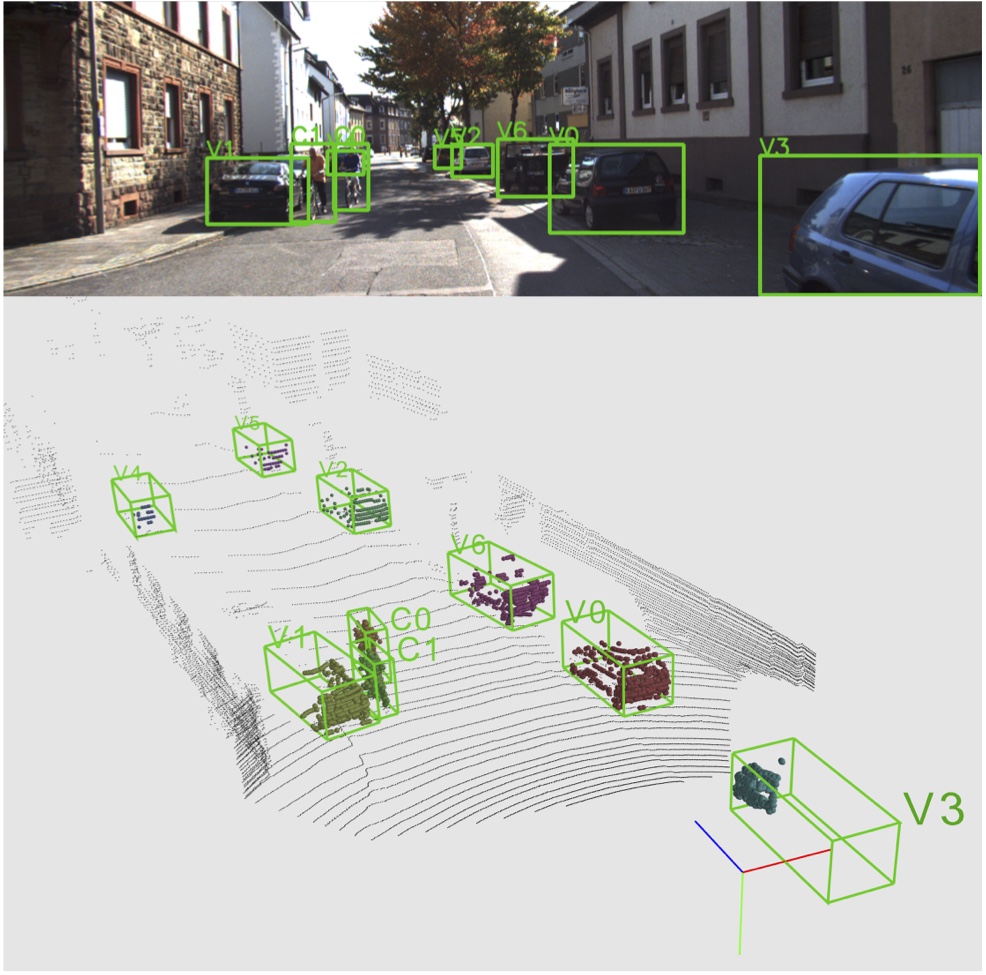
Figure 4. Visualizations of Frustum PointNet results on KITTI val set. Top wide figure displays an RGB image with detected 2D bounding boxes; bottom square figure shows the LiDAR point cloud of the same frame, with predicted 3D bounding boxes. 3D instance masks on point cloud are shown in color. True positive detection boxes are in green, while false positive boxes are in red and groundtruth boxes in blue are shown for false positive and false negative cases. Digit and letter beside each box denote instance id and semantic class, with ``v'' for cars, ``p'' for pedestrian and ``c'' for cyclist. |
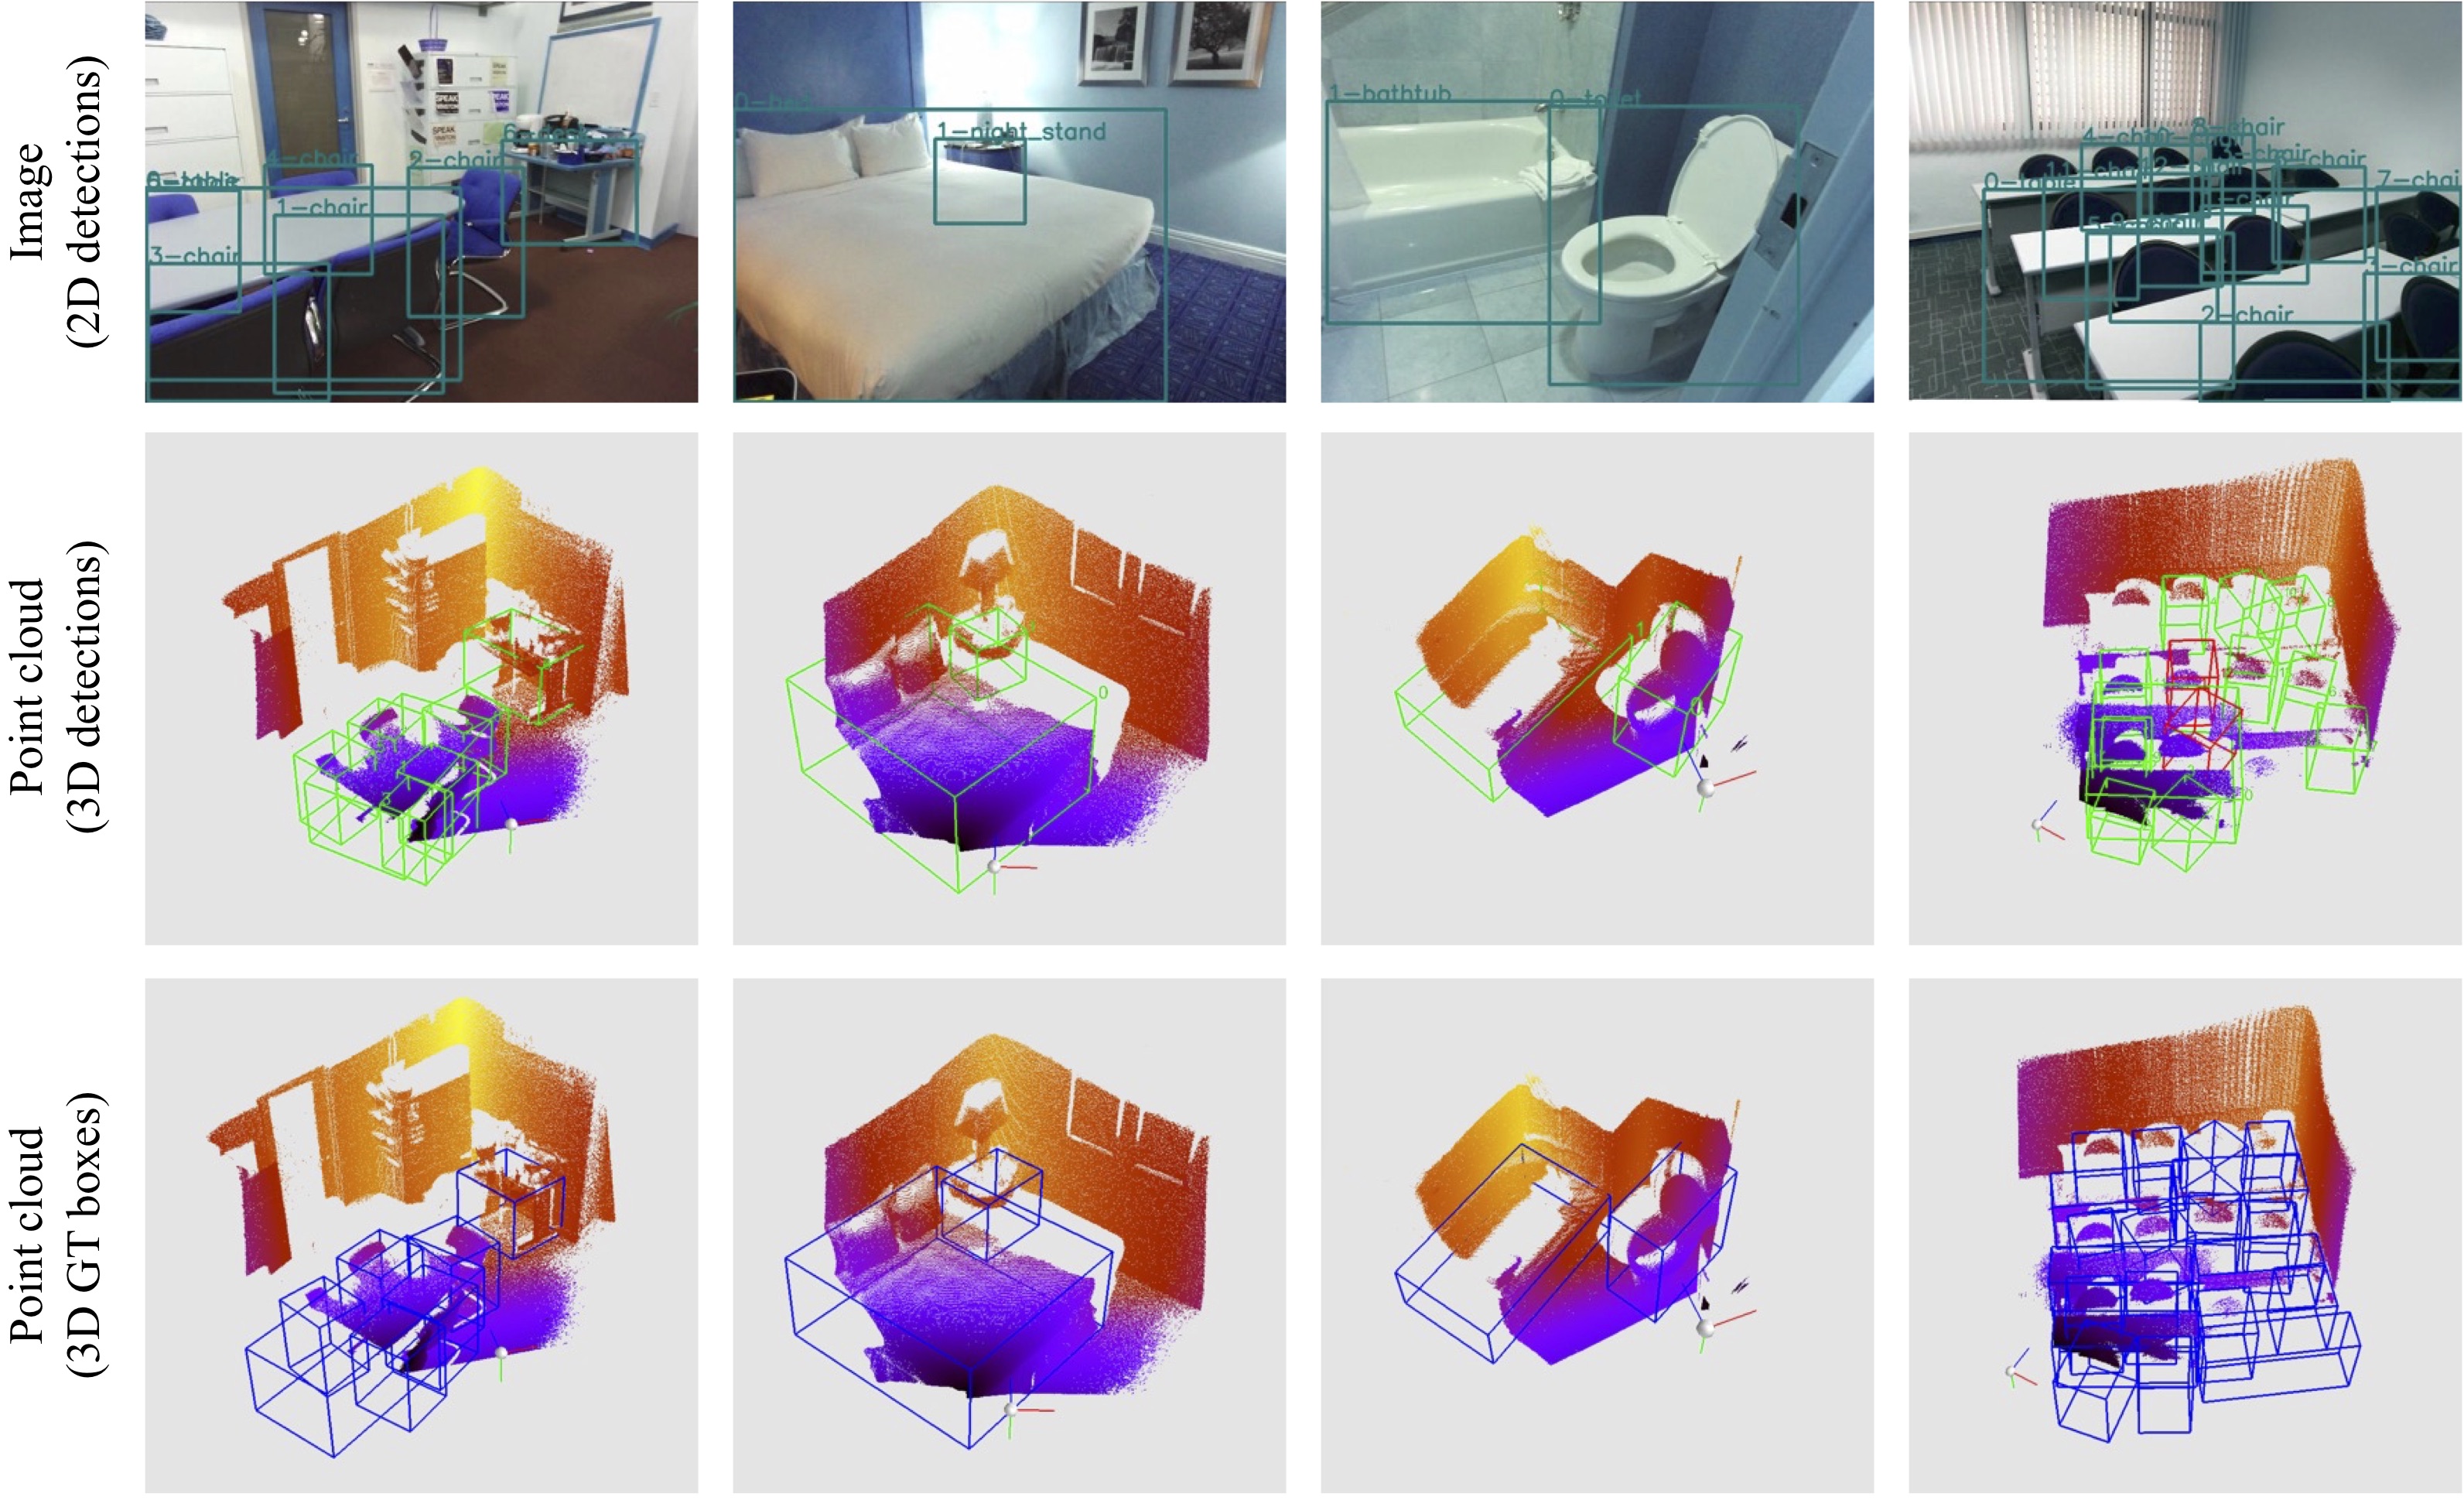
Figure 5. Visualization of Frustum PointNets results on SUN-RGBD val set. First row: RGB image with 2D detection boxes. Second row: point cloud popped up from depth map and predicted amodal 3D bounding boxes (the numbers beside boxes correspond to 2D boxes on images). Green boxes are true positive. Red boxes are false positives. False negatives are not visualized. Third row: point cloud popped up from depth map and ground truth amodal 3D bounding boxes. |