seaborn.plotting_context#
- seaborn.plotting_context(context=None, font_scale=1, rc=None)#
Get the parameters that control the scaling of plot elements.
These parameters correspond to label size, line thickness, etc. For more information, see the aesthetics tutorial.
The base context is “notebook”, and the other contexts are “paper”, “talk”, and “poster”, which are version of the notebook parameters scaled by different values. Font elements can also be scaled independently of (but relative to) the other values.
This function can also be used as a context manager to temporarily alter the global defaults. See
set_theme()orset_context()to modify the global defaults for all plots.- Parameters:
- contextNone, dict, or one of {paper, notebook, talk, poster}
A dictionary of parameters or the name of a preconfigured set.
- font_scalefloat, optional
Separate scaling factor to independently scale the size of the font elements.
- rcdict, optional
Parameter mappings to override the values in the preset seaborn context dictionaries. This only updates parameters that are considered part of the context definition.
Examples
Calling with no arguments will return the current defaults for the parameters that get scaled:
sns.plotting_context()
{'font.size': 10.0,
 'axes.labelsize': 'medium',
 'axes.titlesize': 'large',
 'xtick.labelsize': 'medium',
 'ytick.labelsize': 'medium',
 'legend.fontsize': 'medium',
 'legend.title_fontsize': None,
 'axes.linewidth': 0.8,
 'grid.linewidth': 0.8,
 'lines.linewidth': 1.5,
 'lines.markersize': 6.0,
 'patch.linewidth': 1.0,
 'xtick.major.width': 0.8,
 'ytick.major.width': 0.8,
 'xtick.minor.width': 0.6,
 'ytick.minor.width': 0.6,
 'xtick.major.size': 3.5,
 'ytick.major.size': 3.5,
 'xtick.minor.size': 2.0,
 'ytick.minor.size': 2.0}
Calling with the name of a predefined style will show those values:
sns.plotting_context("talk")
{'axes.linewidth': 1.875,
 'grid.linewidth': 1.5,
 'lines.linewidth': 2.25,
 'lines.markersize': 9.0,
 'patch.linewidth': 1.5,
 'xtick.major.width': 1.875,
 'ytick.major.width': 1.875,
 'xtick.minor.width': 1.5,
 'ytick.minor.width': 1.5,
 'xtick.major.size': 9.0,
 'ytick.major.size': 9.0,
 'xtick.minor.size': 6.0,
 'ytick.minor.size': 6.0,
 'font.size': 18.0,
 'axes.labelsize': 18.0,
 'axes.titlesize': 18.0,
 'xtick.labelsize': 16.5,
 'ytick.labelsize': 16.5,
 'legend.fontsize': 16.5,
 'legend.title_fontsize': 18.0}
Use the function as a context manager to temporarily change the parameter values:
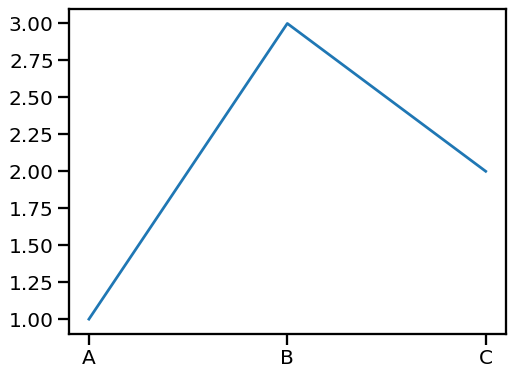
with sns.plotting_context("talk"):
    sns.lineplot(x=["A", "B", "C"], y=[1, 3, 2])