Sam Abrams 5/20/01
Retrospective Voting Project Dr. Fiorina
Each time I've given the talk when I get to the analogy regressions I think
that this isn't the best way to look at the question of whether voters
still give as much credit to politicians for economic performance and
whether Gore got as much credit for the administration's performance as
previous candidates.
On reflection I think the 2-equation procedure I used in RV may be better.
Sam let's do three series of regressions:
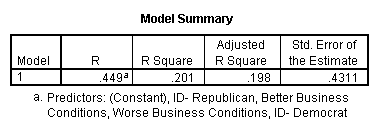
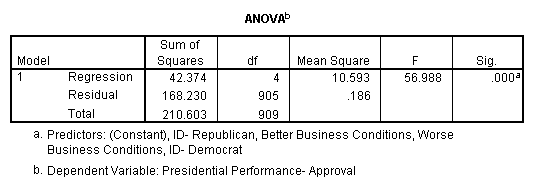
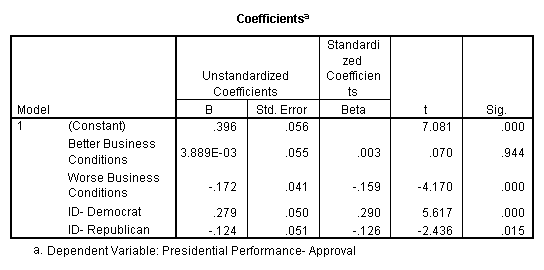
1-2. Regress presidential approval (approve/disapprove) on the two party ID
dummies and the two economic performance dummies. This will indicate
whether there's been any erosion in people's linkage of economic
performance to the president. (do this series for everyone, then repeat
for voters only).
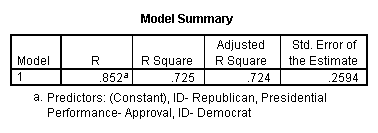
2. Then regress vote (two-party) on party ID and presidential approval
only. This will indicate whether Gore got as much credit for
administration performance as previous candidates.
|
Clinton has the lowest Presidential Performance “Approval”
coefficient in the last 8 Presidential Elections |
||
|
|
Presidential Performance- Approval |
Significance |
|
1972 |
.562 |
.000 |
|
1976 |
.428 |
.000 |
|
1980 |
.424 |
.000 |
|
1984 |
.535 |
.000 |
|
1988 |
.366 |
.000 |
|
1992 |
.373 |
.000 |
|
1996 |
.462 |
.000 |
|
2000 |
.313 |
.000 |
|
|
|
|
Better Economic Conditions
|
||||
|
|
Complete Sample |
Significance |
Voters Only |
Significance |
|
1972 |
.004461 |
.888 |
.009828 |
.783 |
|
1976 |
.07509 |
.005 |
.06183 |
.057 |
|
1980 |
-.0537 |
.436 |
-.0626 |
.457 |
|
1984 |
.156 |
.000 |
.127 |
.000 |
|
1988 |
.09912 |
.000 |
.07880 |
.008 |
|
1992 |
.02536 |
.555 |
.02120 |
.671 |
|
1996 |
.136 |
.000 |
.148 |
.000 |
|
2000 |
.07574 |
.001 |
.08146 |
.002 |
|
|
|
|
|
|
Worse Economic Conditions
|
||||
|
|
Complete Sample |
Significance |
Voters Only |
Significance |
|
1972 |
-.125 |
.007 |
-.119 |
.028 |
|
1976 |
-.147 |
.000 |
-.157 |
.000 |
|
1980 |
-.229 |
.000 |
-.192 |
.000 |
|
1984 |
-.214 |
.000 |
-.219 |
.000 |
|
1988 |
-.150 |
.000 |
-.147 |
.000 |
|
1992 |
-.214 |
.000 |
-.199 |
.000 |
|
1996 |
-.177 |
.000 |
-.154 |
.000 |
|
2000 |
-.116 |
.000 |
-.102 |
.005 |
|
|
|
|
|
|
1972 Presidential
Performance Regression- Complete Sample


1972 Presidential Performance
Regression- Voters Only


1972 Vote Regression


1976 Presidential
Performance Regression- Complete Sample


1976 Presidential
Performance Regression- Voters Only


1976 Vote Regression


1980 Presidential
Performance Regression- Complete Sample


1980 Presidential
Performance Regression- Voters Only


1980 Vote Regression


1984 Presidential
Performance Regression- Complete Sample


1984 Presidential
Performance Regression- Voters Only


1984 Vote Regression


1988 Presidential
Performance Regression- Complete Sample


1988 Presidential Performance Regression- Voters Only


1988 Vote Regression


1992 Presidential
Performance Regression- Complete Sample


1992 Presidential
Performance Regression- Voters Only


1992 Vote Regression


1996 Presidential
Performance Regression- Complete Sample


1996 Presidential
Performance Regression- Voters Only


1996 Vote Regression
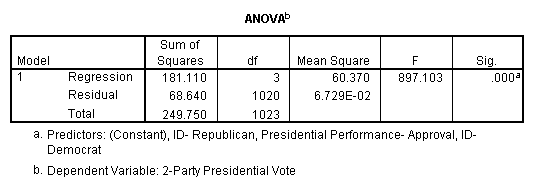
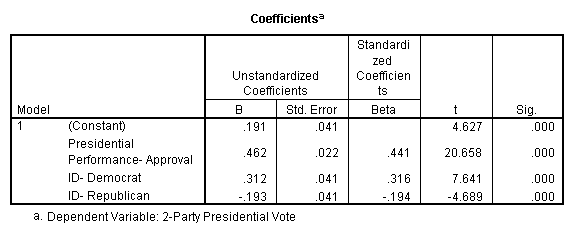
2000 Presidential
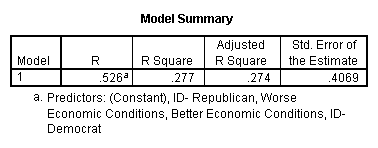
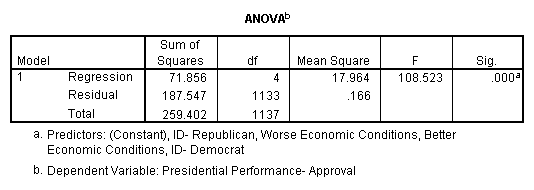
Performance Regression- Complete Sample
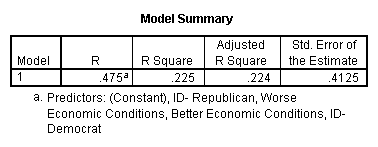
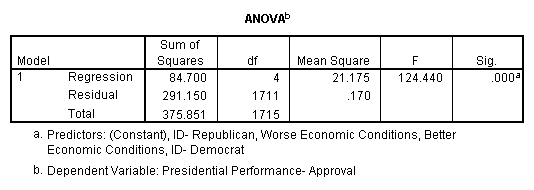
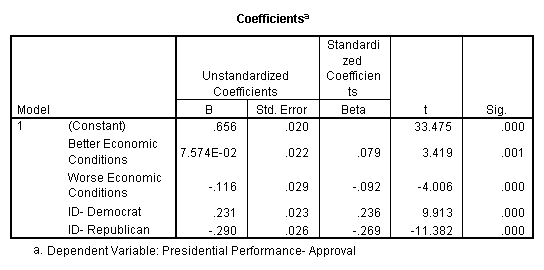
2000 Presidential
Performance Regression- Voters Only

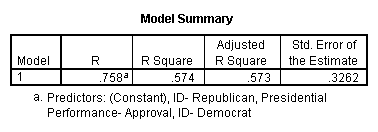
2000 Vote Regression
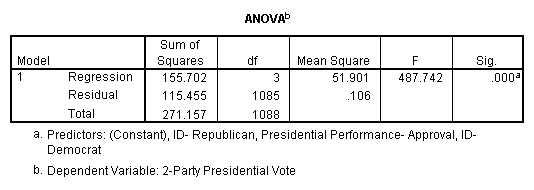

Addendum:
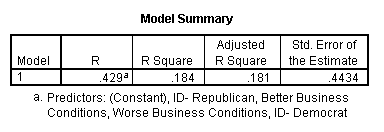
1980 Presidential
Performance Regression- Complete Sample and Business Conditions
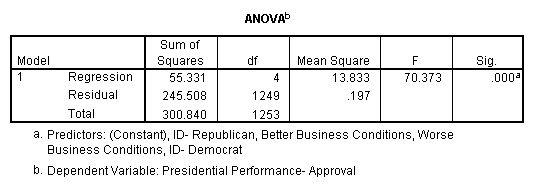
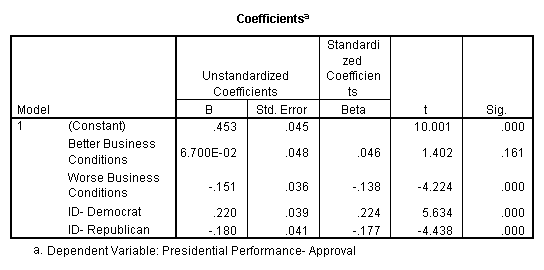
1980 Presidential
Performance Regression- Voters Only and Business Conditions
