Introduction
In our upcoming paper
Subgraph
Frequencies: Mapping the Empirical and Extremal Geography
of Large Graph Collections" (PDF), to appear in May 2013 at the
22nd ACM International World Wide Web Conference,
we found
that there are fundamental combinatorial constraints governing the frequency
of subgraphs that constrain all graphs in previously undocumented ways.
We also found that there are
empirical properties of social graphs that relegate their subgraph
frequencies to a seriously restricted subspace of the full feasible space.
Together, we present two complementary frameworks that shed light
on a fundamental question pertaining to social graphs:
What properties of social graphs are 'social' properties and
what properties are 'graph' properties?
Harnessing our results more generally, we are in fact able to show that almost all $k$ node subgraphs have a frequency that is non-trivially bounded. Thus, there is an extent to which almost all subgraphs are mathematically 'forbidden' from occurring beyond a certain frequency.
What are subgraph frequencies?
Subgraph frequencies describe a graph by the frequencies with
which all possible small subgraphs occur within it.
More precisely, we choose a small number $k$ (e.g. $k = 3$ or $4$);
then, for a graph $G$,
we create a vector with a coordinate for each
distinct $k$-node subgraph $H$, specifying the fraction of $k$-tuples
of nodes in $G$ that induce a copy of $H$ (in other words, the frequency of
$H$ as an induced subgraph of $G$).
Let $s(H,G)$
denote the subgraph frequency of $H$ in $G$.
We can also equivalently define the subgraph frequency $s(H,G)$ as
the probability that a random $k$-node subset of nodes in $G$ induces
a copy of $H$.
For $k=3$, these descriptions correspond
to what is sometimes referred to as the triad census.
For $k=3$ and $k=4$, here is what all the undirected subgraphs look like (there are 4 three-node graphs and 11 four-node graphs):
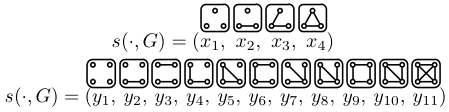
The orders presented here are also the orders used in the discussion
below.
So what do subgraph frequencies look like empirically?
This work was done in collaboration with Facebook (while the first author
was visiting Facebook through their internship program), making it possible
to see what a really large collection of graphs look like on
a detailed subgraph level.
We extracted three different collections of social graphs
from Facebook: neighborhoods, groups and events. The collections
are all induced graphs from the Facebook friendship graph, which
records friendship connections as undirected edges between users,
and thus all our induced graphs are also undirected.
We did not include edges formed by Facebook 'subscriptions' in our study,
nor did we include Facebook 'pages' or connections from users
to such pages.
All Facebook social graph data was analyzed in an anonymous, aggregated form.
We studied:
- Neighborhoods: Graphs induced by the friends of a single Facebook user ego and the friendship connections among these individuals (excluding the ego).
- Groups: Graphs induced by the members of a 'Facebook group', a Facebook feature for organizing focused conversations between a small or moderate-sized set of users.
- Events: Graphs induced by the confirmed attendees of 'Facebook events', a Facebook feature for coordinating invitations to calendar events. Users can response 'Yes', 'No', and 'Maybe' to such invitations, and we consider only users who respond 'Yes'.
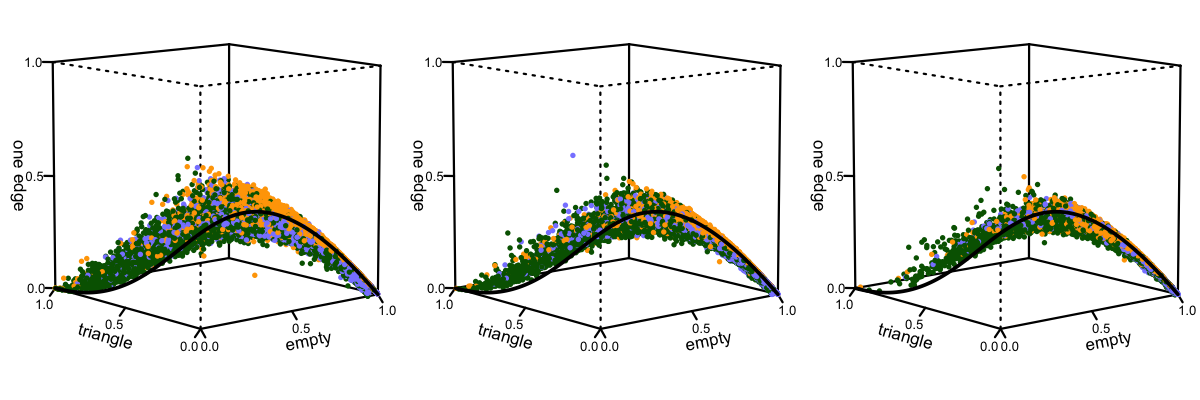
The black line corresponds to the expected frequencies for $G_{n,p}$, the Erdos-Renyi random graph family, as a function of edge density $p$. The paper contains more details, but the main point to notice for now is that these thousands of graphs are empirically concentrated to a very particular subspace of the simplex.
Is the entire simplex of frequencies feasible?
No! The frequencies of 3-node and 4-node subgraphs live
in a 4-simplex and an 11-simplex, respectively.
The frequencies of 3-node subgraphs for the
social graphs shown above certainly don't fill the 4-simplex,
and it turns out: there are fundamental constraints on what
subgraph frequencies can look like that constrain all graphs,
not just social graphs.
The constraints on the subgraph frequencies follow from what
are known as 'graph homomorphism inequalities', which
are fundamental combinatorial relationships that govern
how subgraphs co-occur. It turns out that there are many
combinations of subgraphs that are fundamentally infeasible.
To prove this infeasibility, we used several graph homomorphism inequalities
(specifically: Kruskal-Katona, Moon-Moser, and the
Sidorenko Tree Bound)
and related the frequencies of all the subgraphs in a possible graph
to the edge density of the graph.
The edge density is really just the subgraph
frequency of the two-node clique in the graph, and so we can
relate other subgraph frequencies to it via homomorphism inequalities.
This part of the work gets rather technical, and is outlined
in the
paper (PDF).
By sweeping over all edge densities, we found that
the homomorphism inequalities we studied combine to
restrict the abundancy of all subgraphs that are not
empty and not complete graphs. Below is Figure 5
from our paper, where each x-axis is edge density,
from 0.0 to 1.0, and the green boxes are the limits
set by the combined homomorphism inequalities. The scattered
dots are the frequencies of empirical 50-node graphs from Facebook.
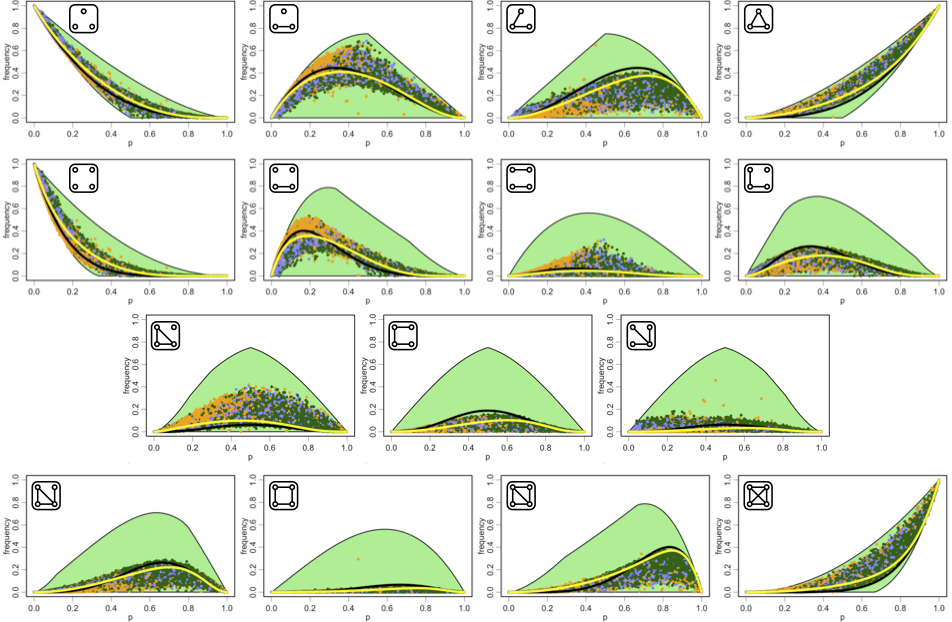
The black lines are again $G_{n,p}$ as a function of $p$, and we'll explain the yellow lines futher along (it's related to the empirical framework describe below). Notice here that the 'forbidden triad' can not occur with a frequency of more than 2/3 in any graph, not just social graphs. Notice that squares are also very rare by both combinatorial constraints and even more so empirically. While working on this paper, our working title for the work was actually "It's Hip to Be Square," but we ended up going for a more serious title, for better or worse.
None of the green boxes except those for the empty and complete subgraphs ever touch "1.0". As we prove formally in the paper (see Proposition 4.9) it turns out that no subgraph, other than the empty or complete subgraphs, can ever occur with 100% frequency in a large enough graph.
There are some details of the results that we're glossing over here: the green bounds are only outer bounds, and considering additional graph homomorphism inequalities may very well tighten the green boxes. We do however know that large tracts of the green space are inhabitable by graphs but no social graphs appear there. See the end of Section 4.3 for details.
For more on the theory of graph homomorphisms, see the excellent survey by Borgs, Chayes, Lovaz, Sos, and Vesztergombi on Counting Graph Homomorphisms (PDF) or the equally excellent broader survey by Lovasz on Very Large Graphs.
What more can we say about empirical social graphs?
When examining the two figures reproduced above,
it should actually come as a surprise that $G_{n,p}$,
the Erdos-Renyi random graph family, traces
the empirical distribution of subgraphs so well. Recall that
only a handful of properties of social networks are
replicated well by simple
Erdos-Renyi graphs. For example,
they do have a small (logarithmic) diameter. But most important
properties require more sophisticated models: clustering
(Watts & Strogatz 1998)
and navigability
(Kleinberg 2000)
being important
examples.
Having noticed this close match between our subgraph frequency
data and the expected behavior of the Erdos-Renyi model,
we were able to design a concise random walk
view of edge formation using the theory of
Markov chains.
The 'Edge Formation Random Walk'
framework we developed starts out by reexamining $G_{n,p}$ on a subgraph level.
With this new perspective, we are then able to easily tinker with the
ways in which edges are formed.
Specifically, we were able to extend our model away from merely describing
$G_{n,p}$ by introducing an extra formation force
caused by triadic closure,
the tendency of people to be introduced by mutual acquaintances. Adding
this force we were then able to ask:
how does the
equillibrium distribution of such a perturbed model
compare to empirical social graphs?
Here is the transition diagram of our markov chain on
four-node graphs. It's very pretty:
Fitting the parameters of this model to our datasets, it turns out that random edge formation plus solely triadic closure describes the subgraph frequencies of our graphs with remarkable accuracy. Here are the frequencies of the 4-node subgraphs of neighborhoods, taken from Figure 4, with a logarithmic y-axis:
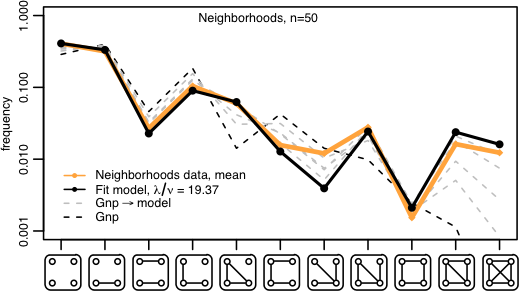
Looking at the above figure, first notice how good the fit is: the data is the orange line and the model is the black line. Next, notice again how rare squares are. We actually first observed this in our 2012 PNAS paper on 'Structural Diversity on Social Contagion', co-authored also with Cameron Marlow at Facebook, where squares were incredibly rare in the email dataset we were examining. This is clear from the large error bars on Figure 1(d) of that paper. The behavior of the fit model is also seen as the yellow lines in the earlier figure on extremal bounds.
The sole point of disagreement between the model and the data, the four node star, is likely explainable through higher order forces: triadic closure as a theory only effects triplets of individuals, and understanding the overabundance of four node stars can probably be understood by incorporating some model of larger group formation. But we haven't looked so closely at this.
We hope that our Edge Formation Random Walk model provides a useful framework for exploring subgraph frequencies not just in social graphs but also other graphs: other perturbations may give wildly different frequencies appropriate for describing other contexts very different from social networks.
A take-away lesson: Sometimes observations about social networks are observations about people, sometimes they're observations about graphs. Be careful distinguishing the two!
Finally, for a wonderful classic example of the importance of the question, "What is
a property of people and what is a property of graphs?",
see The
Princeton Companion to Mathematics, Section IV.19
Extremal and Probabilistic Combinatorics (PDF here),
which relates the story of the Hungarian sociologist Sandor Szalai
and his accidental rediscovery of Ramsey Theory.
Is there code to play with?
Yes. We are releasing code written in R for computing the extremal bounds found in the paper, and also for solving for the equilibrium of the Edge Formation Random Walk model:
This script computes the subgraph frequency bounds described above, and helps illustrate how the different inequalities combine to form the extremal bounds. In particular, it can be instructive to modify the boolean variables such as 'bool_KruskalKatona' to turn the different inequalities on or off. This code requires the R package 'lpSolve' for solving Linear Programs.The script also includes a solver of the Edge Formation Random Walk model for arbitrary values of $\lambda$, which are graphically overlaid on top of the bounds (along with $G_{n,p}$, which corresponds to $\lambda=0$).