Contents
Generate problem data
rand('seed', 0);
randn('seed', 0);
m = 1000;
n = 100;
A = randn(m,n);
x0 = 10*randn(n,1);
b = A*x0;
idx = randsample(m,ceil(m/50));
b(idx) = b(idx) + 1e2*randn(size(idx));
Solve problem
[x history] = lad(A, b, 1.0, 1.0);
iter	    r norm	   eps pri	    s norm	  eps dual	 objective
  1	   30.1596	   34.3292	  690.6743	    6.9077	   4773.18
  2	    3.7155	   34.3292	  688.4685	    6.8857	   4637.05
  3	    3.0866	   34.3292	  682.3849	    6.8248	   4152.80
  4	    3.8887	   34.3292	  671.2751	    6.7138	   3675.84
  5	    4.5094	   34.3292	  656.2406	    6.5634	   3222.49
  6	    5.0494	   34.3292	  641.7290	    6.4183	   2786.84
  7	    4.9828	   34.3292	  630.5902	    6.3069	   2372.09
  8	    4.7762	   34.3292	  610.1365	    6.1024	   1993.60
  9	   10.4738	   34.3292	  377.8906	    3.7799	   1798.79
 10	   12.5191	   34.3292	   28.8587	    0.2896	   1790.43
 11	    2.1989	   34.3292	   42.5469	    0.4265	   1780.46
 12	    0.9115	   34.3292	   18.6326	    0.1873	   1776.38
 13	    0.7020	   34.3292	    1.3172	    0.0142	   1776.70
 14	    0.0953	   34.3292	    3.3369	    0.0344	   1777.30
 15	    0.0848	   34.3292	    1.0074	    0.0111	   1777.44
 16	    0.0440	   34.3292	    0.2302	    0.0033	   1777.39
 17	    0.0023	   34.3292	    0.2495	    0.0035	   1777.36
 18	    0.0072	   34.3292	    0.0494	    0.0015	   1777.35
 19	    0.0027	   34.3292	    0.0264	    0.0013	   1777.36
 20	    0.0003	   34.3292	    0.0176	    0.0012	   1777.36
 21	    0.0006	   34.3292	    0.0017	    0.0010	   1777.36
 22	    0.0001	   34.3292	    0.0025	    0.0010	   1777.36
 23	    0.0000	   34.3292	    0.0012	    0.0010	   1777.36
 24	    0.0000	   34.3292	    0.0001	    0.0010	   1777.36
Elapsed time is 0.079891 seconds.
Reporting
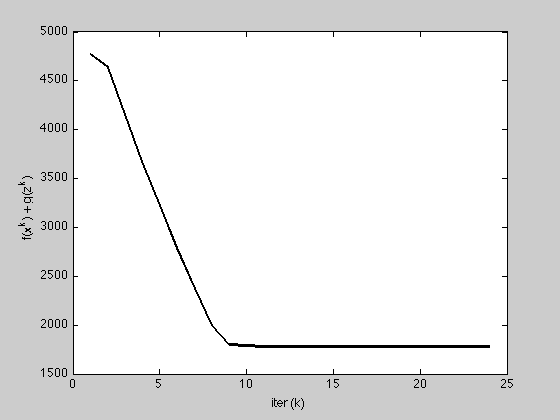
K = length(history.objval);
h = figure;
plot(1:K, history.objval, 'k', 'MarkerSize', 10, 'LineWidth', 2);
ylabel('f(x^k) + g(z^k)'); xlabel('iter (k)');
g = figure;
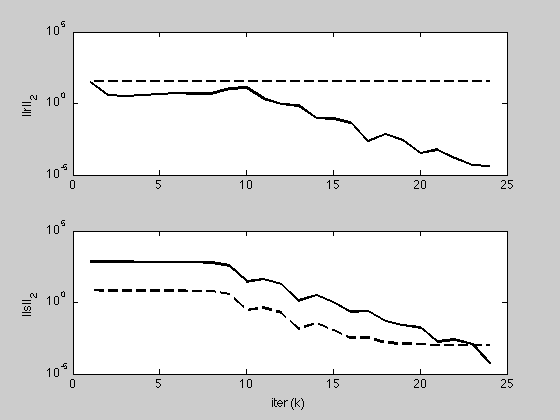
subplot(2,1,1);
semilogy(1:K, max(1e-8, history.r_norm), 'k', ...
1:K, history.eps_pri, 'k--', 'LineWidth', 2);
ylabel('||r||_2');
subplot(2,1,2);
semilogy(1:K, max(1e-8, history.s_norm), 'k', ...
1:K, history.eps_dual, 'k--', 'LineWidth', 2);
ylabel('||s||_2'); xlabel('iter (k)');